Free Access
Fig. A.3.
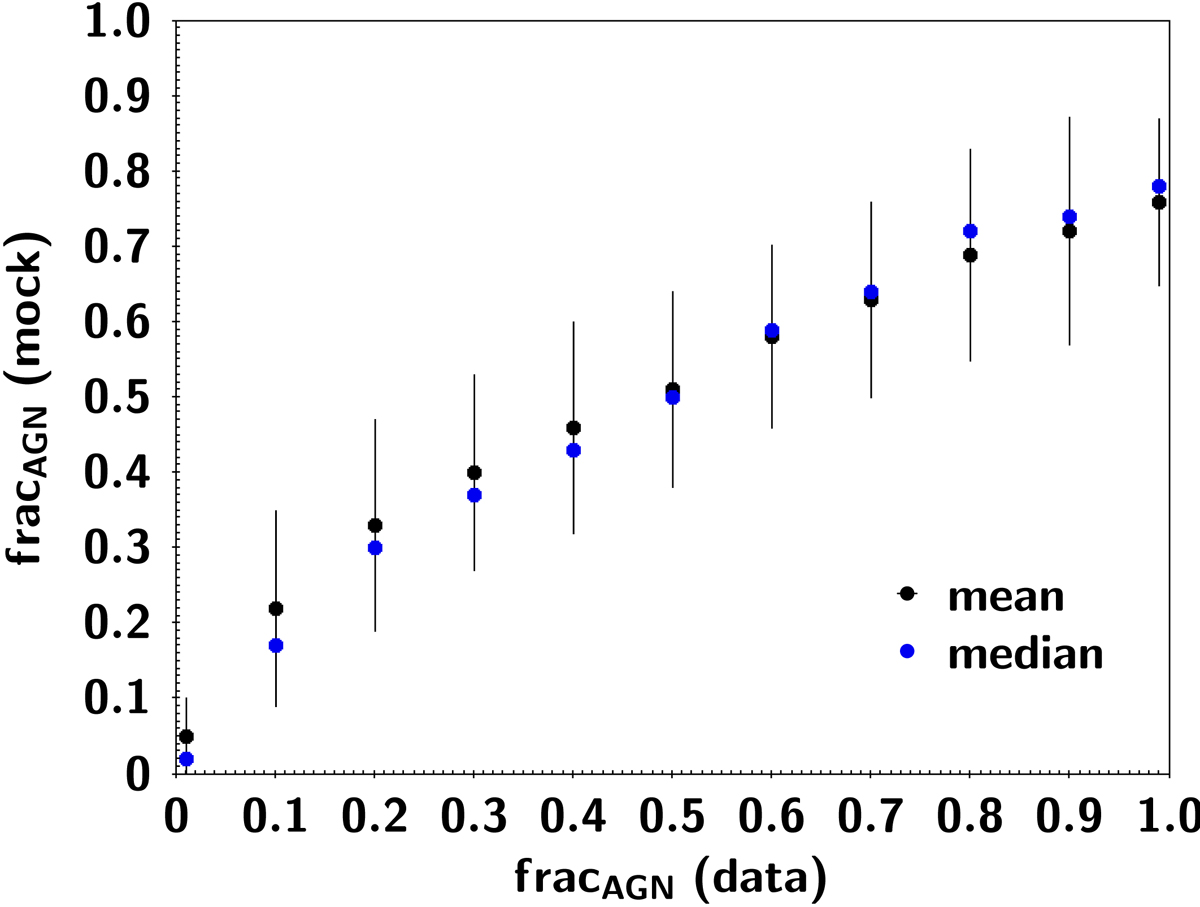
AGN fraction values estimated by the fit of the mock catalogue vs. the true values (from the fit of the data). Circles present the mean measurements and their standard deviation is also plotted. Median values are shown by triangles.
Current usage metrics show cumulative count of Article Views (full-text article views including HTML views, PDF and ePub downloads, according to the available data) and Abstracts Views on Vision4Press platform.
Data correspond to usage on the plateform after 2015. The current usage metrics is available 48-96 hours after online publication and is updated daily on week days.
Initial download of the metrics may take a while.