Fig. 9.
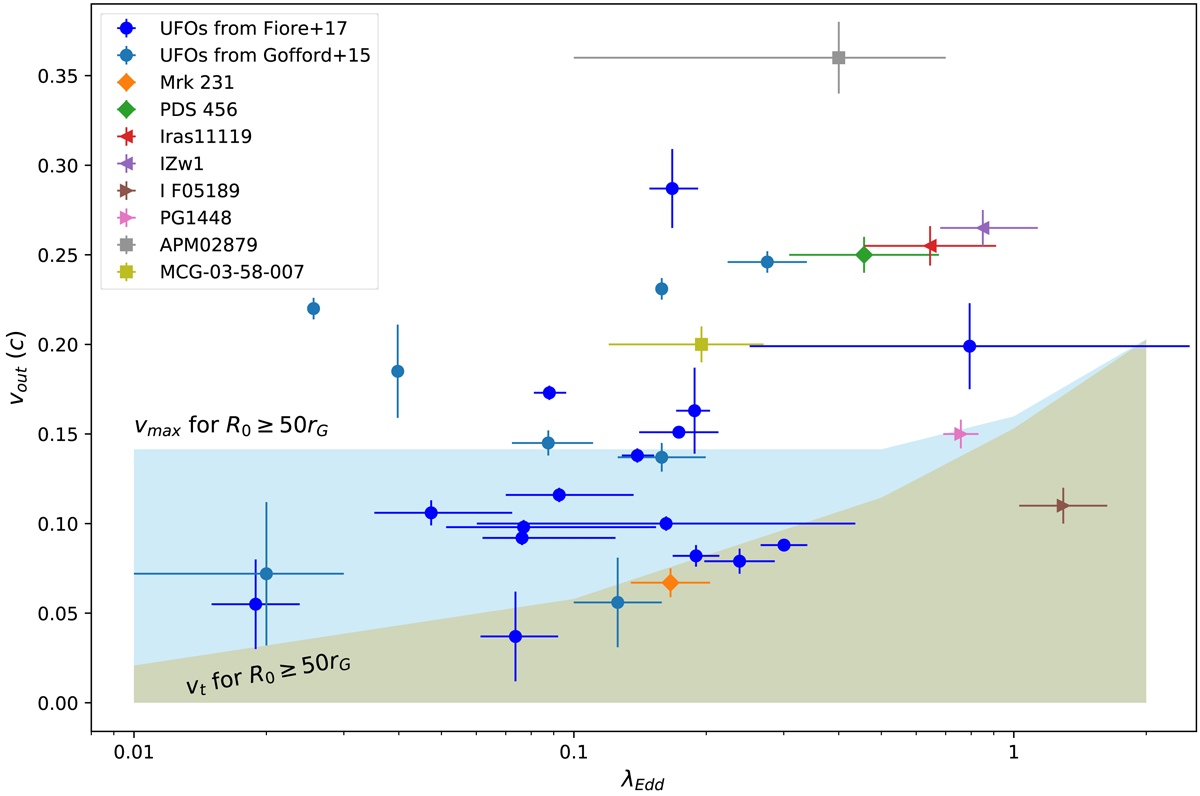
Comparison between UFO velocities from the literature (dots and squares) and the results of the present work as a function of λEdd. The theoretical limit according to the terminal velocity, vt, for R0 ≥ 50 rG corresponds to the orange shaded area. The limit according to the maximum (but short-lived) velocity, vmax, corresponds to the light-blue area. See Appendix E for a description of the sample and the related references.
Current usage metrics show cumulative count of Article Views (full-text article views including HTML views, PDF and ePub downloads, according to the available data) and Abstracts Views on Vision4Press platform.
Data correspond to usage on the plateform after 2015. The current usage metrics is available 48-96 hours after online publication and is updated daily on week days.
Initial download of the metrics may take a while.