Fig. 8.
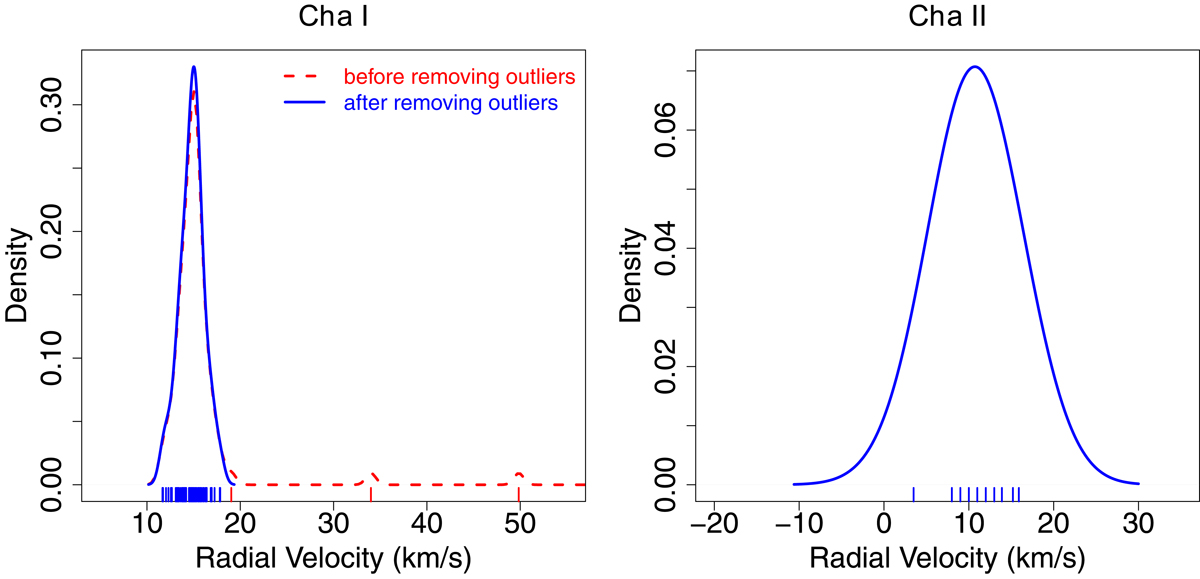
Kernel density estimate of the RV distribution for the stars in Cha I (left panel) and Cha II (right panel). We used the mean precision of the RVs in each sample (see text in Sect. 3.1) as kernel bandwidth. The tick marks in the horizontal axis mark the RVs of individual stars. The star with the most discrepant RV in the Cha I sample, namely Gaia DR2 5201347408553455616 (Vr = 164.11 ± 1.61 km s−1, Sacco et al. 2017), is not shown to improve the visibility of the plot.
Current usage metrics show cumulative count of Article Views (full-text article views including HTML views, PDF and ePub downloads, according to the available data) and Abstracts Views on Vision4Press platform.
Data correspond to usage on the plateform after 2015. The current usage metrics is available 48-96 hours after online publication and is updated daily on week days.
Initial download of the metrics may take a while.