Fig. 11.
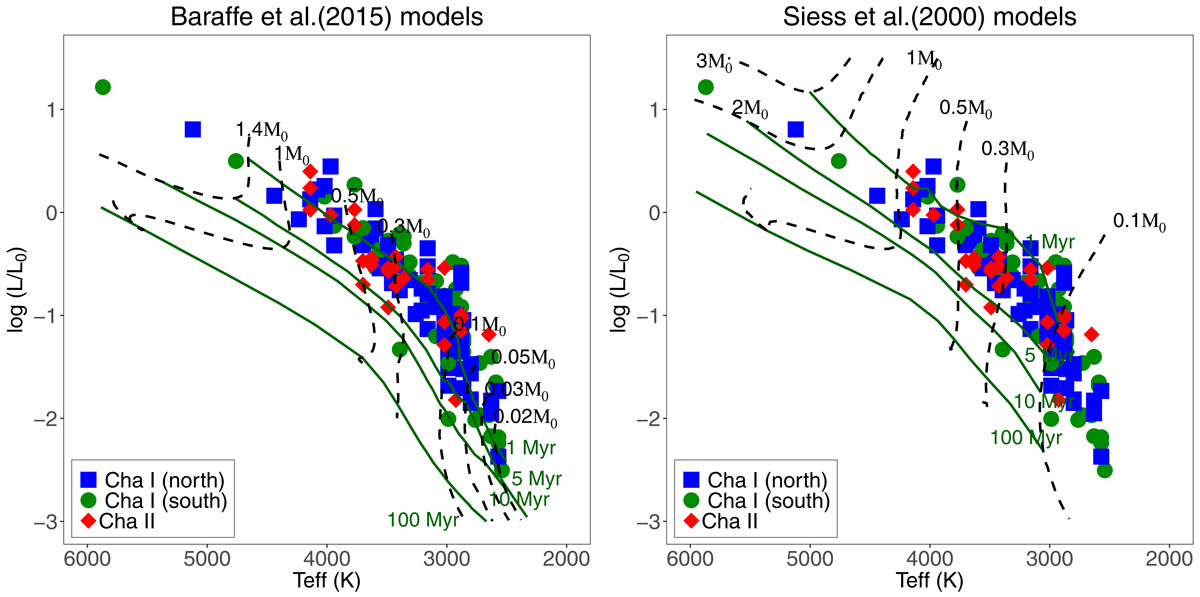
HRD of the Chamaeleon star-forming region compared to the grid of isochrones and tracks from pre-main sequence stars models. The green solid and black dashed lines denote the isochrones and tracks for each model, respectively, with the ages (in Myr) and masses (in M⊙) indicated in the panels. The different colours and symbols represent the Chamaeleon subgroups discussed throughout this paper. The most massive star in our sample, namely Gaia DR2 5201128124701636864, is not shown here to improve the visibility of the low-mass stars that largely dominate our sample.
Current usage metrics show cumulative count of Article Views (full-text article views including HTML views, PDF and ePub downloads, according to the available data) and Abstracts Views on Vision4Press platform.
Data correspond to usage on the plateform after 2015. The current usage metrics is available 48-96 hours after online publication and is updated daily on week days.
Initial download of the metrics may take a while.