Fig. 1.
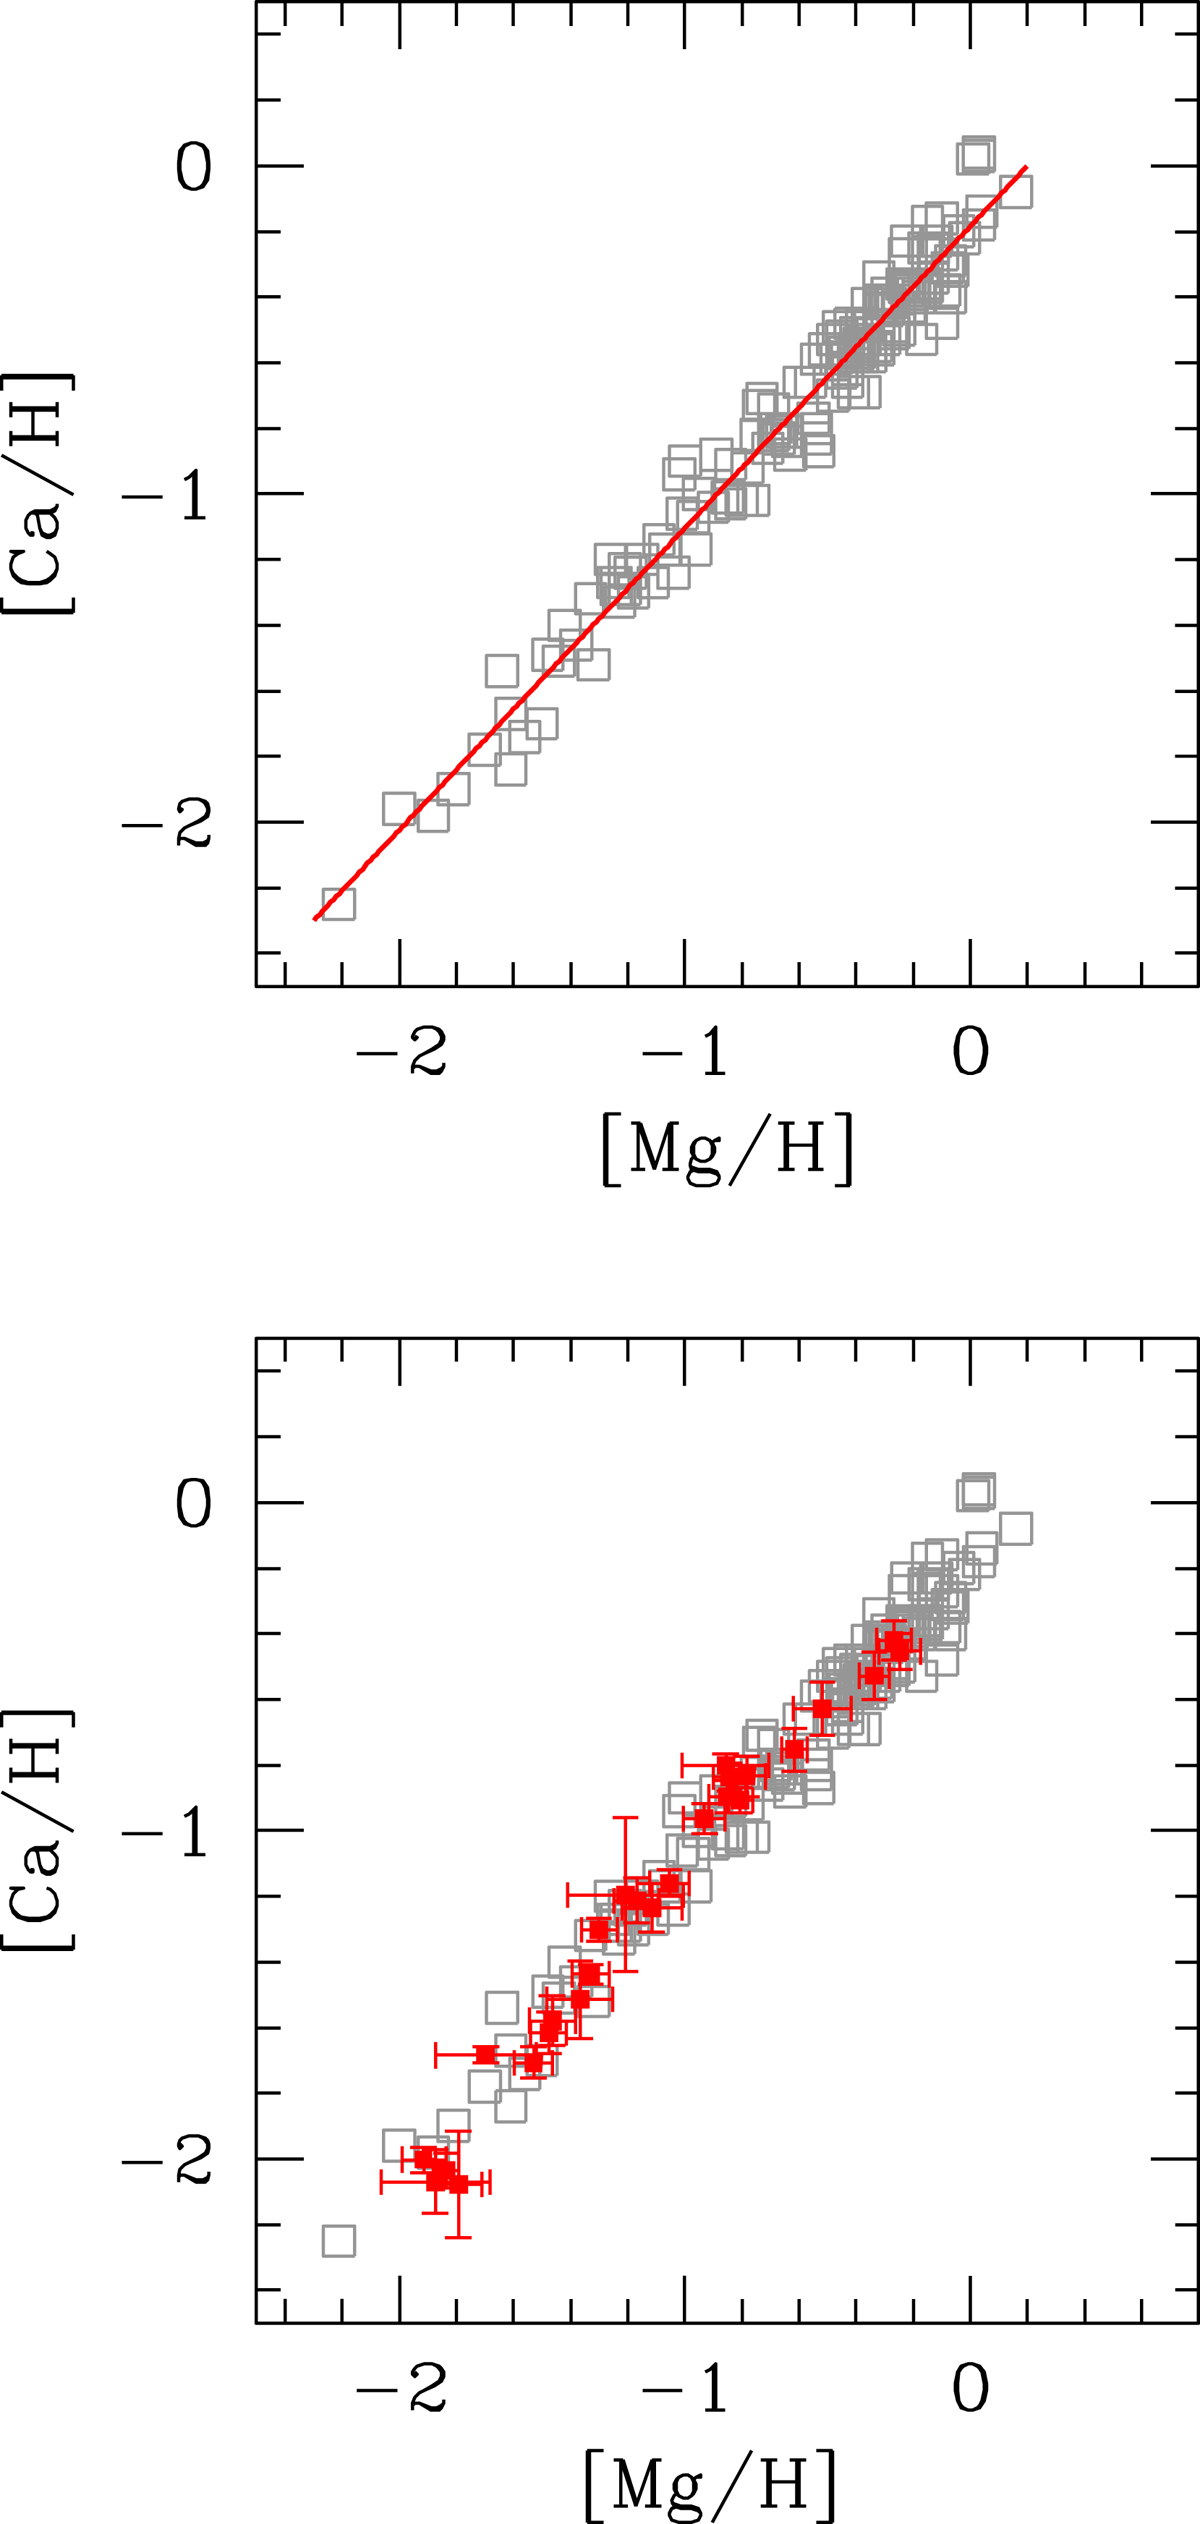
Upper panel: [Ca/H] ratios as a function of [Mg/H] for the field stars in the sample of Gratton et al. (2003). The linear fit to the data we used to rectify the [Ca/H] values is superimposed. Lower panel: same as in the upper panel. The mean values and rms scatter of GCs in our golden and silver samples are superimposed (see text).
Current usage metrics show cumulative count of Article Views (full-text article views including HTML views, PDF and ePub downloads, according to the available data) and Abstracts Views on Vision4Press platform.
Data correspond to usage on the plateform after 2015. The current usage metrics is available 48-96 hours after online publication and is updated daily on week days.
Initial download of the metrics may take a while.