Fig. 8.
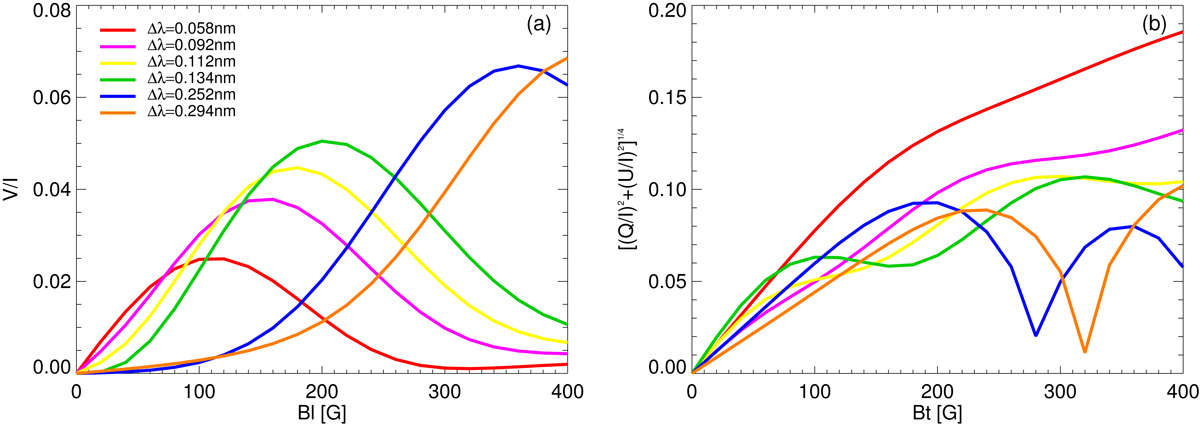
Single-wavelength calibration curves for different wavelengths. Panel a: calibration relation of the Bl and Stokes V/I for the Mg I 12.32 μm line in the FALC model with a magnetic field strength 0–400 G. Panel b: same as panel a, but the calibration relationship between Bt and Stokes (Q/I, U/I). Different colors are for different wavelength positions toward the line center (λ0 = 12319.246 nm). The selected wavelength positions are the same for Bl and Bt.
Current usage metrics show cumulative count of Article Views (full-text article views including HTML views, PDF and ePub downloads, according to the available data) and Abstracts Views on Vision4Press platform.
Data correspond to usage on the plateform after 2015. The current usage metrics is available 48-96 hours after online publication and is updated daily on week days.
Initial download of the metrics may take a while.