Fig. 9.
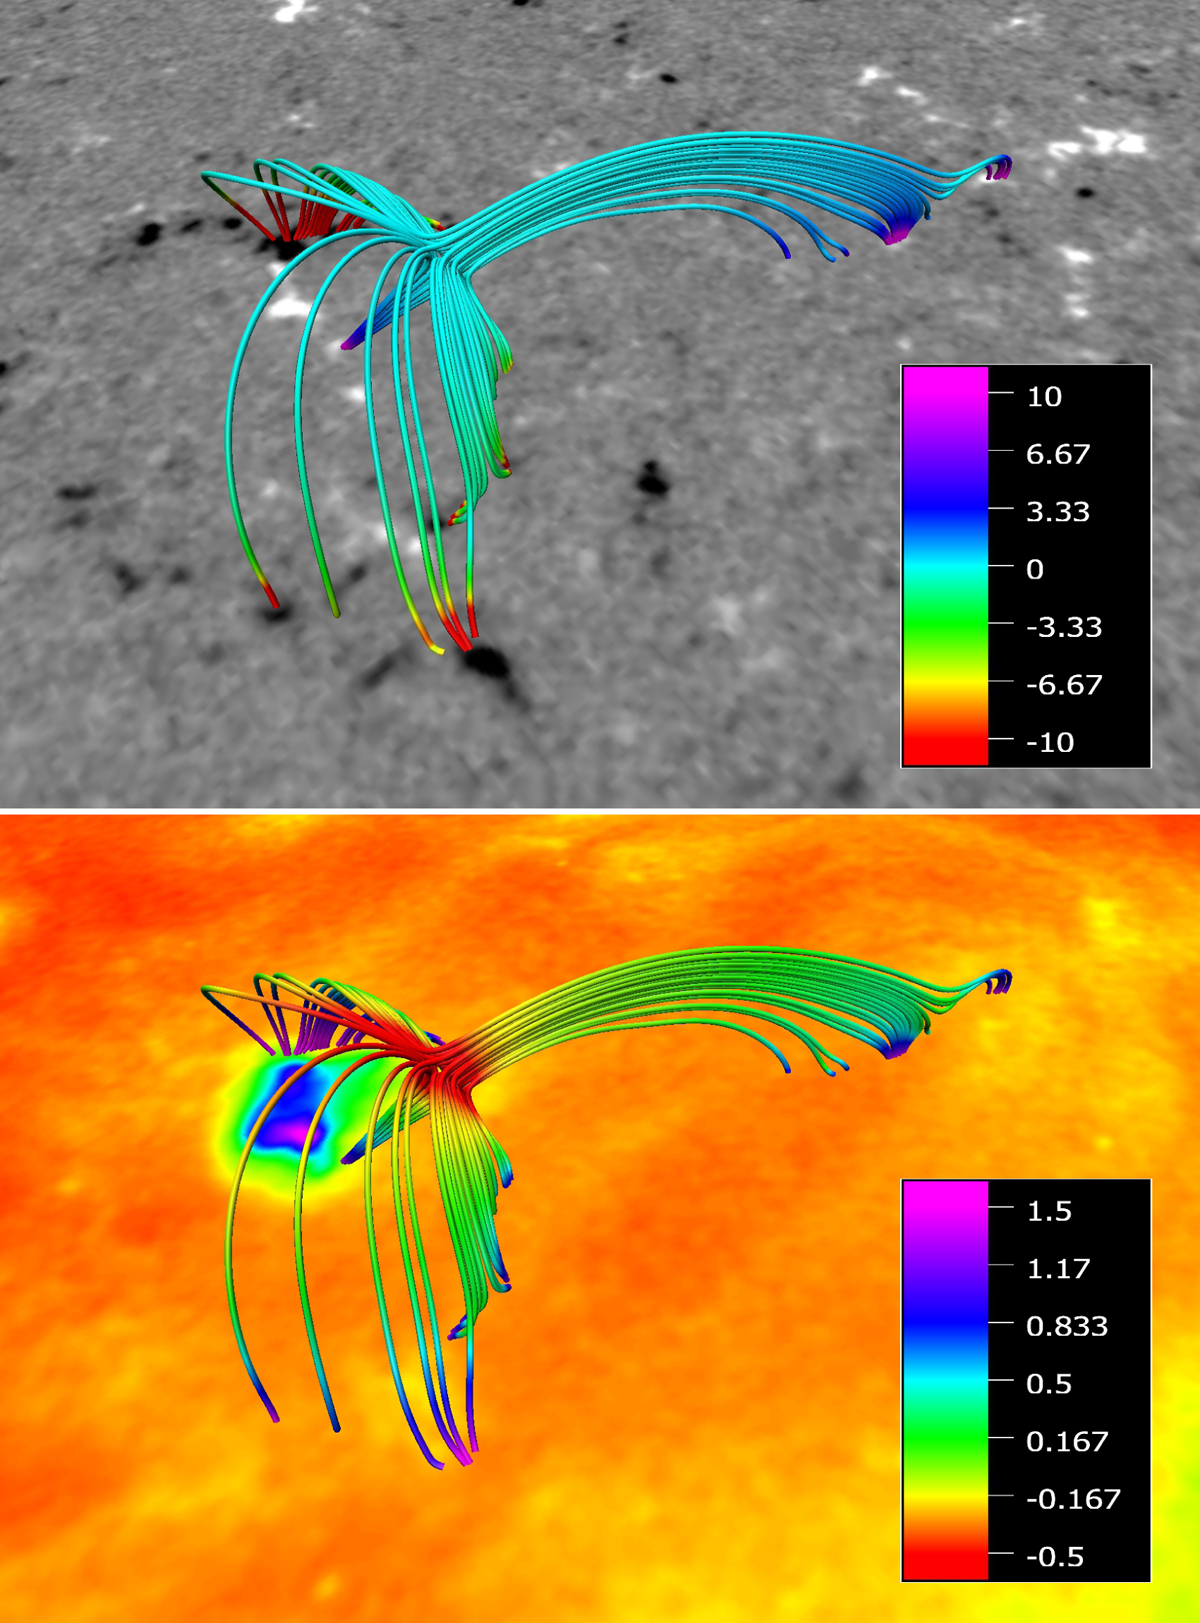
Potential field extrapolation of the coronal magnetic field overlying the CBP at 17:21 UT. Top panel: background image is the HMI magnetogram from which the extrapolation has been made. The field lines are coloured according to the value of the vertical field component, with values in gauss as in the colour bar. Bottom panel: same but overlaid on a co-temporal AIA 193 image. The field line colours correspond to the logarithm of |B|.
Current usage metrics show cumulative count of Article Views (full-text article views including HTML views, PDF and ePub downloads, according to the available data) and Abstracts Views on Vision4Press platform.
Data correspond to usage on the plateform after 2015. The current usage metrics is available 48-96 hours after online publication and is updated daily on week days.
Initial download of the metrics may take a while.