Fig. 8.
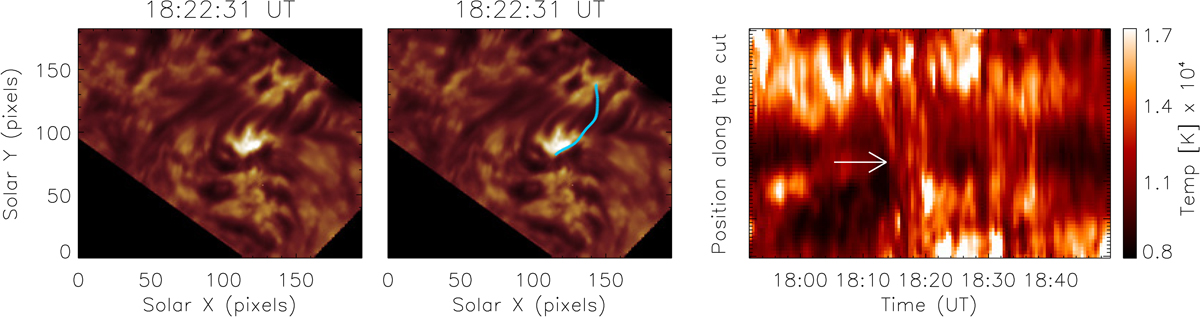
Temperature increase in the HLs. Left and middle: Hα line-core intensity images. The blue line on the middle-panel image outlines the position of the pixels used to produce the hydrogen temperature time-distance image. Right: hydrogen temperature time-distance image. The arrow points at the start of the heating episode of the HLs. The pixel size is 0.16″.
Current usage metrics show cumulative count of Article Views (full-text article views including HTML views, PDF and ePub downloads, according to the available data) and Abstracts Views on Vision4Press platform.
Data correspond to usage on the plateform after 2015. The current usage metrics is available 48-96 hours after online publication and is updated daily on week days.
Initial download of the metrics may take a while.