Fig. 7.
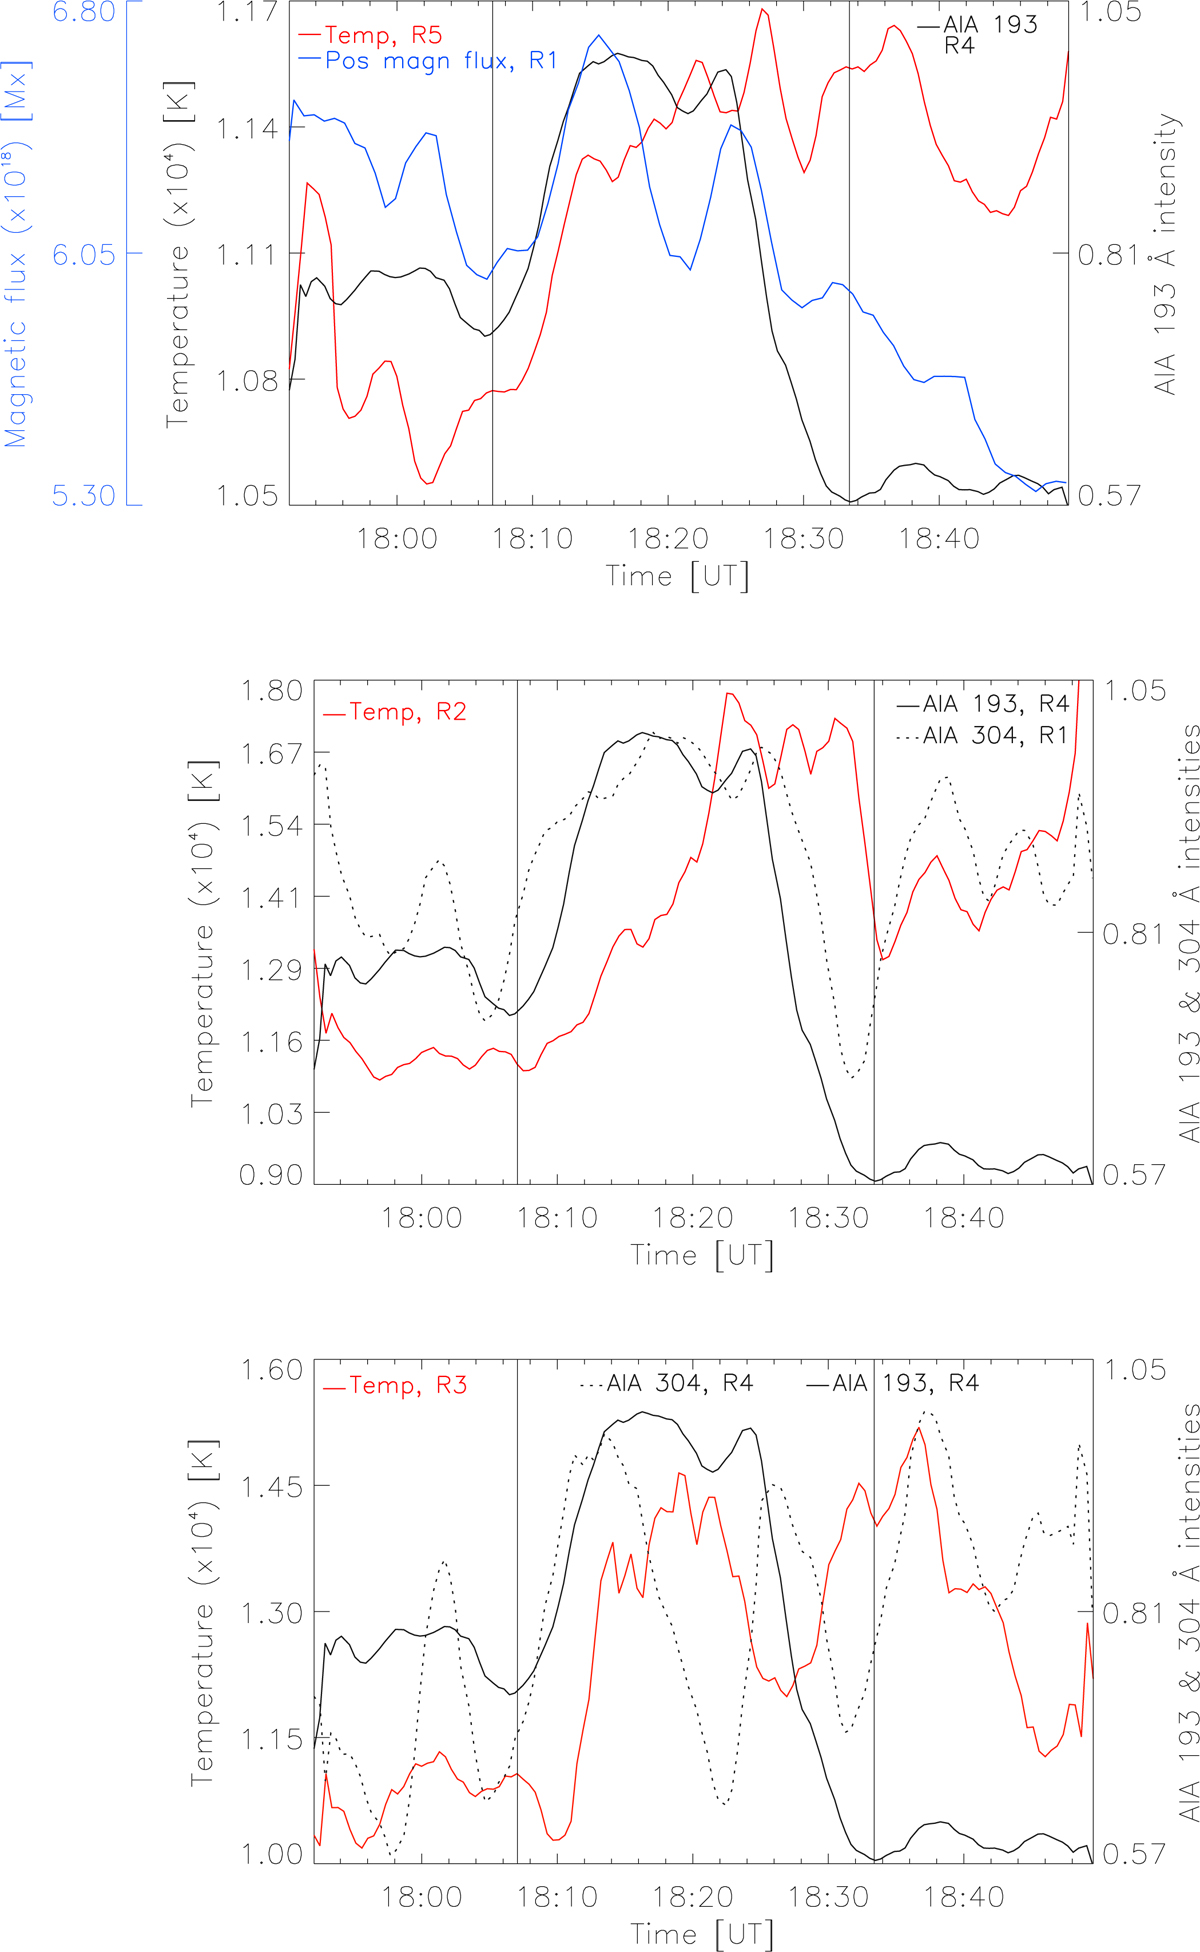
Hydrogen temperature variations with respect to the magnetic flux, AIA 193, and AIA 304 intensity variations of the CBP. Top: averaged temperature obtained from the whole CBP (R5). The total positive magnetic flux (R1) and the AIA 193 intensity (R4). Middle: averaged temperature in the CBP south footpoint, R2. The AIA 304 is taken from the same area as the positive flux (R1). Bottom: temperature estimated from the small area of one of the HLs, R3. The AIA 304 is taken from the same area of the CBP loops as AIA 193, R4.
Current usage metrics show cumulative count of Article Views (full-text article views including HTML views, PDF and ePub downloads, according to the available data) and Abstracts Views on Vision4Press platform.
Data correspond to usage on the plateform after 2015. The current usage metrics is available 48-96 hours after online publication and is updated daily on week days.
Initial download of the metrics may take a while.