Fig. 6.
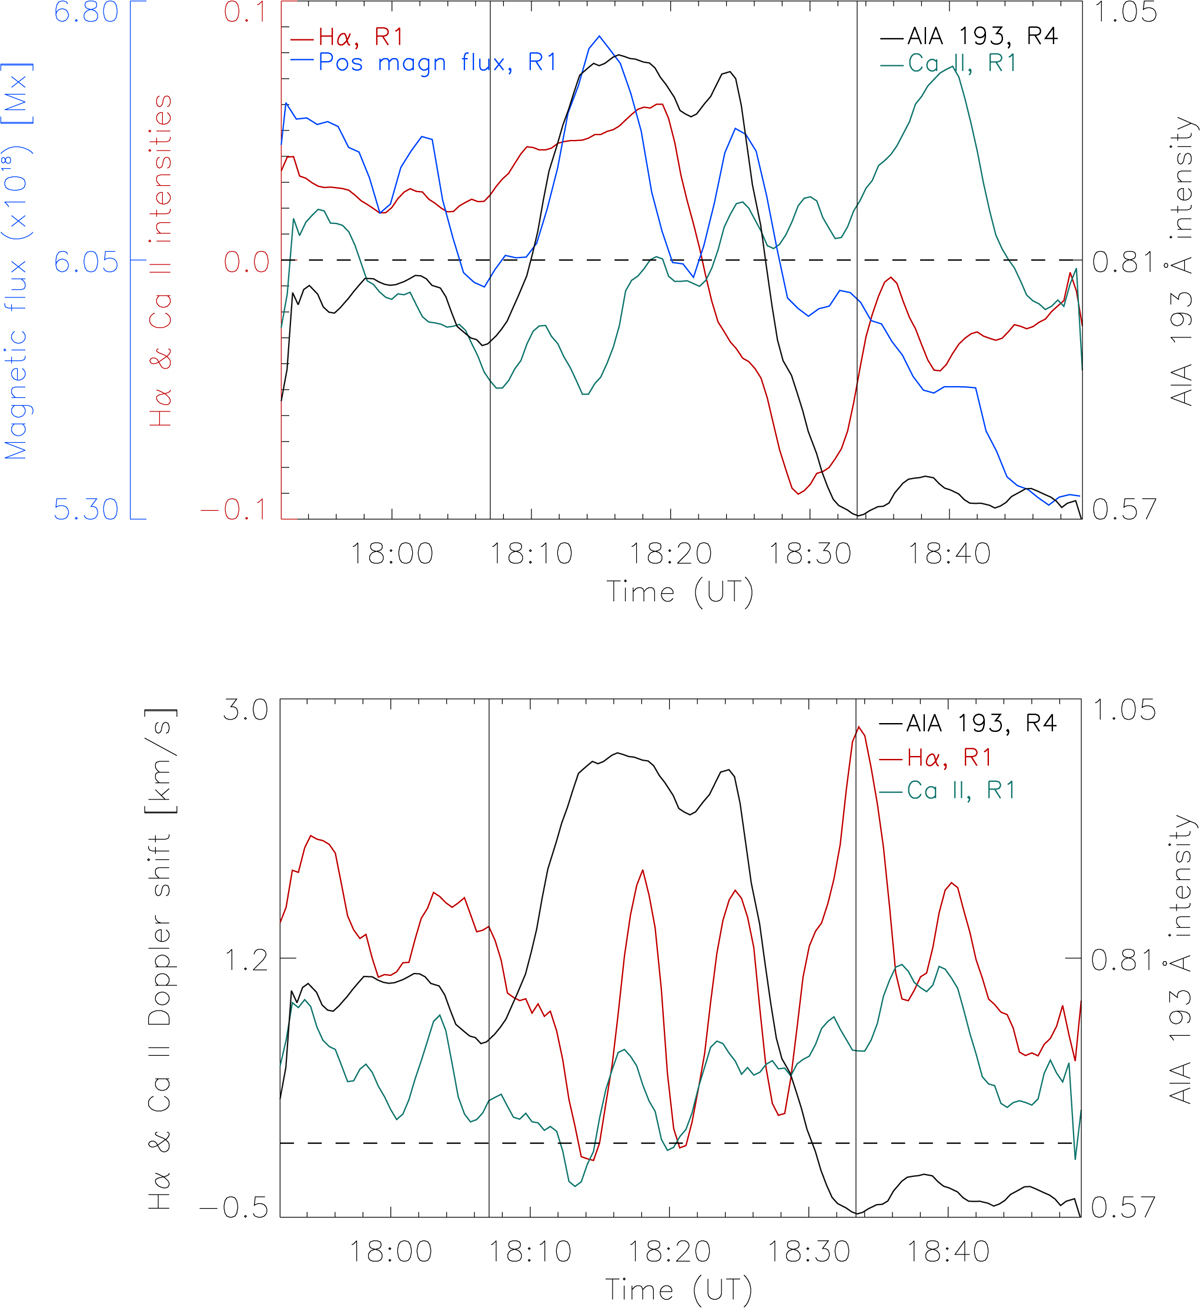
Temporal variations of the Ca II and Hα line-core intensities and Ca II and Hα Doppler shift produced from the south footpoint of the CBP. Top: total positive magnetic flux, Ca II and Hα line-core intensities taken from R1 together with the AIA 193 intensity from R4. Bottom: Ca II and Hα Doppler-shift taken from R1, and the AIA 193 intensity from R4. The horizontal dashed line indicates the zero Doppler-shift value.
Current usage metrics show cumulative count of Article Views (full-text article views including HTML views, PDF and ePub downloads, according to the available data) and Abstracts Views on Vision4Press platform.
Data correspond to usage on the plateform after 2015. The current usage metrics is available 48-96 hours after online publication and is updated daily on week days.
Initial download of the metrics may take a while.