Fig. 5.
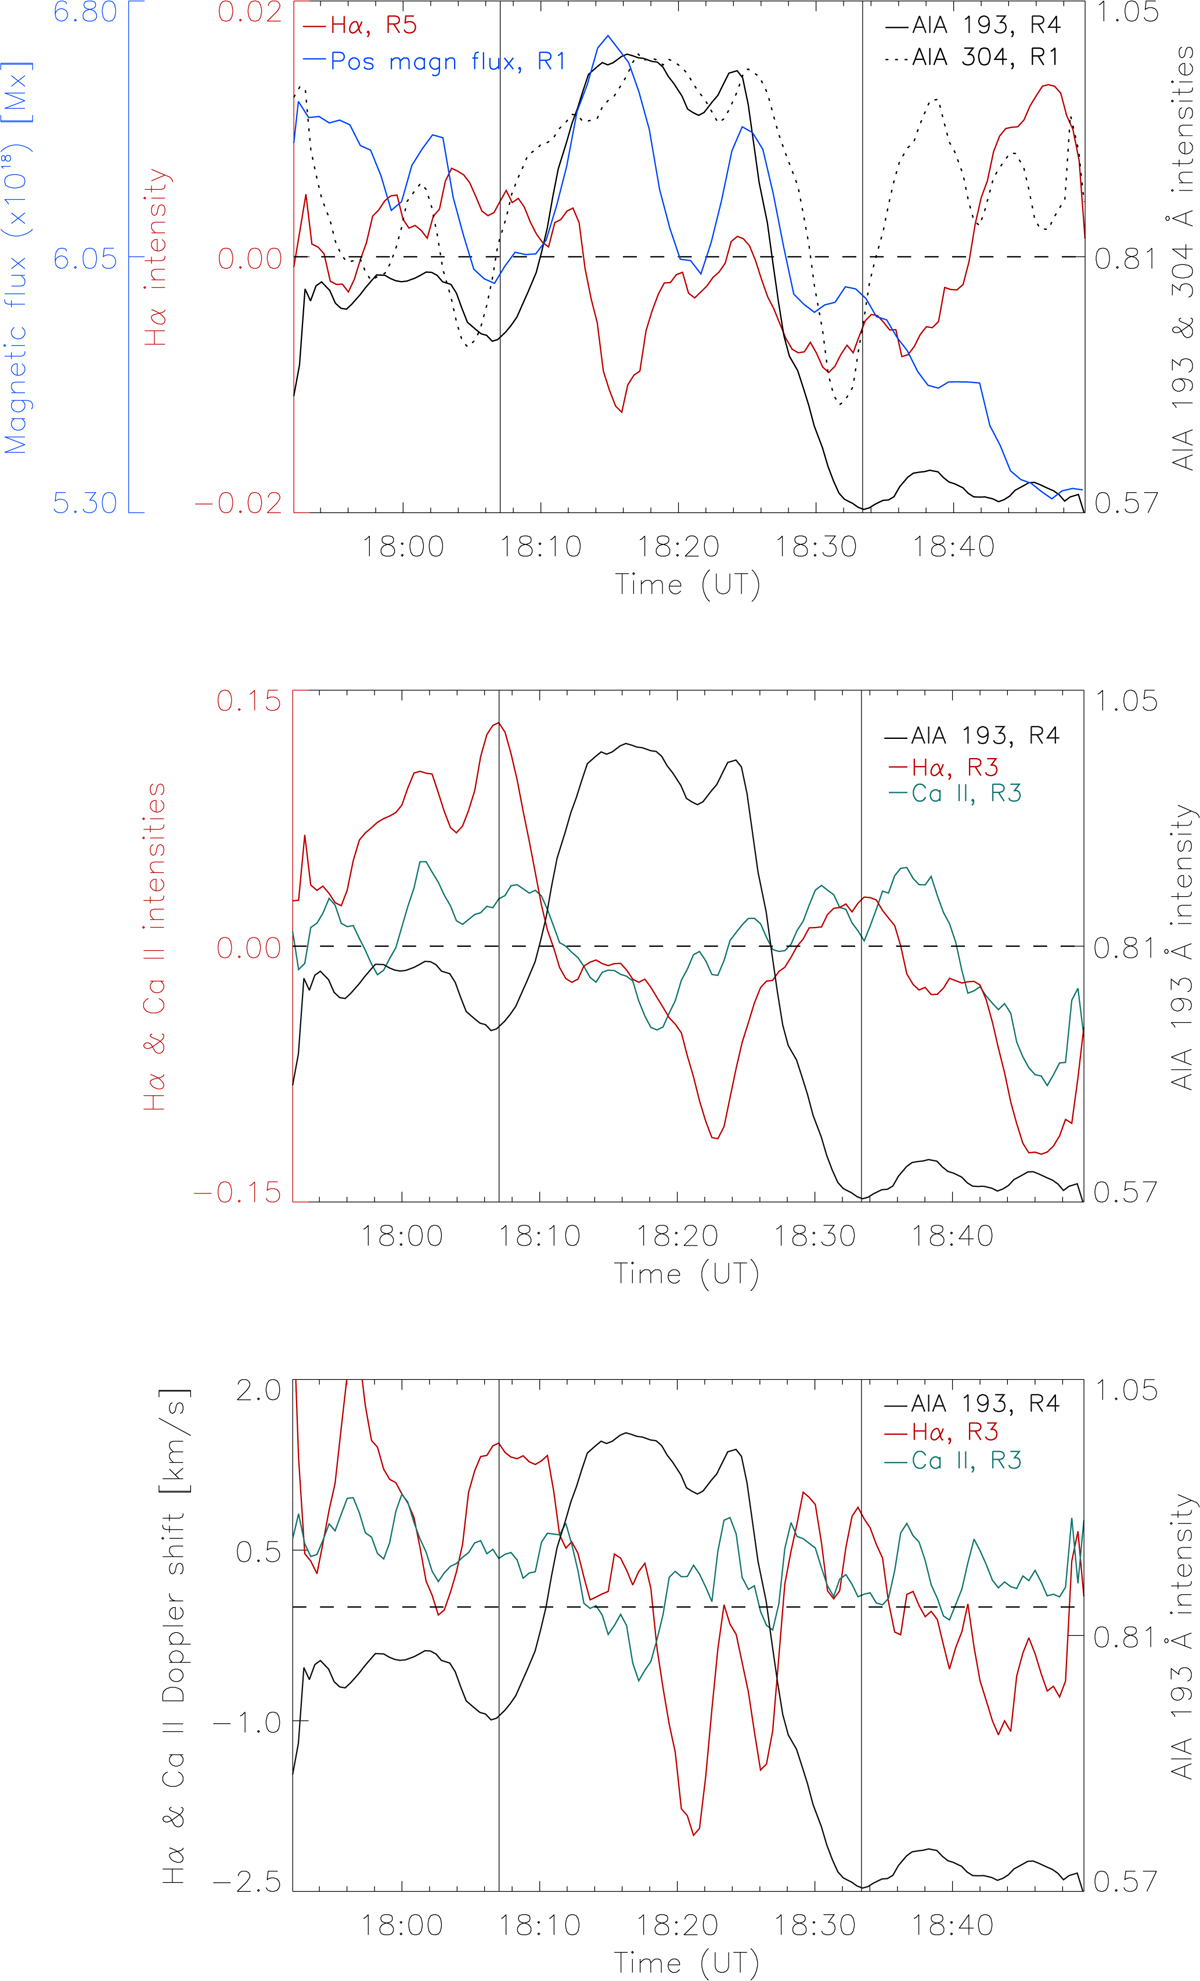
Temporal variations of the coronal, transition-region, and chromospheric emission, Ca II and Hα Doppler shift, and positive magnetic flux of the CBP. Top panel: total positive magnetic flux and AIA 304 normalized intensity taken from R1 shown in Fig. 2, AIA 193 normalized intensity produced from R4 shown on the AIA 193 in Fig. 2, and the Hα intensity produced from the sum of the intensity in the blue and red wing at ±45 Å averaged from R5. Middle panel: Ca II and Hα line-core intensities produced from one of the HLs, R3. Bottom panel: Ca II and Hα Doppler-shift variations in R3 as in the middle panel. The horizontal dashed line indicates the zero Doppler-shift value. The AIA 193 intensity temporal variations (R4) are shown for reference in both the middle and bottom panels.
Current usage metrics show cumulative count of Article Views (full-text article views including HTML views, PDF and ePub downloads, according to the available data) and Abstracts Views on Vision4Press platform.
Data correspond to usage on the plateform after 2015. The current usage metrics is available 48-96 hours after online publication and is updated daily on week days.
Initial download of the metrics may take a while.