Fig. 4.
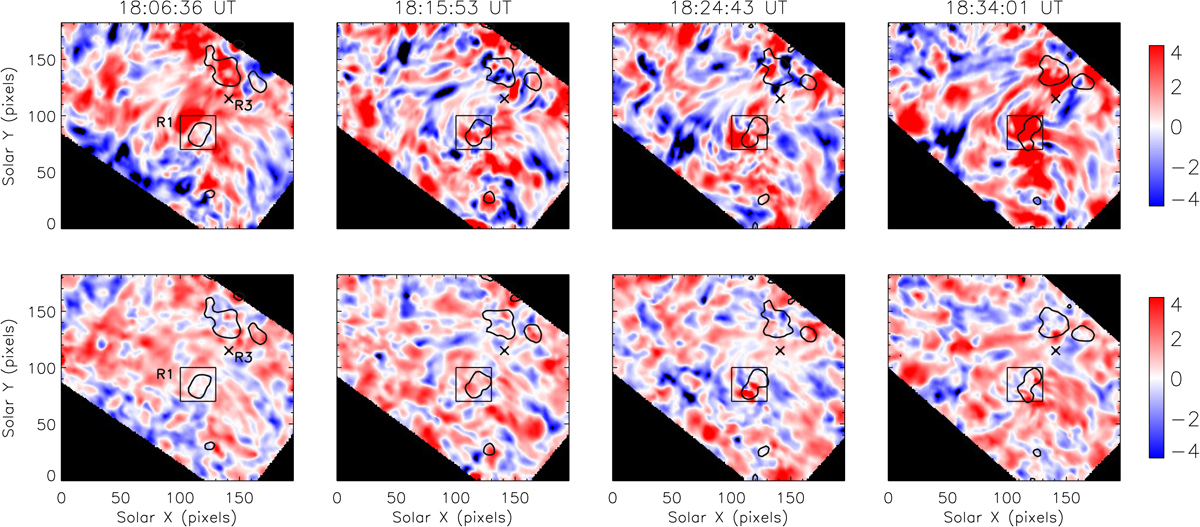
Hα (top row) and Ca II (bottom row) Doppler velocity images at the corresponding times as in Fig. 2. The square indicates where the Doppler-shift temporal variation in the south footpoint was obtained. The cross denotes the centre of the small area from which the Doppler-shift temporal variation in the Hα loop was obtained. The pixel size is 0.16″.
Current usage metrics show cumulative count of Article Views (full-text article views including HTML views, PDF and ePub downloads, according to the available data) and Abstracts Views on Vision4Press platform.
Data correspond to usage on the plateform after 2015. The current usage metrics is available 48-96 hours after online publication and is updated daily on week days.
Initial download of the metrics may take a while.