Fig. 3.
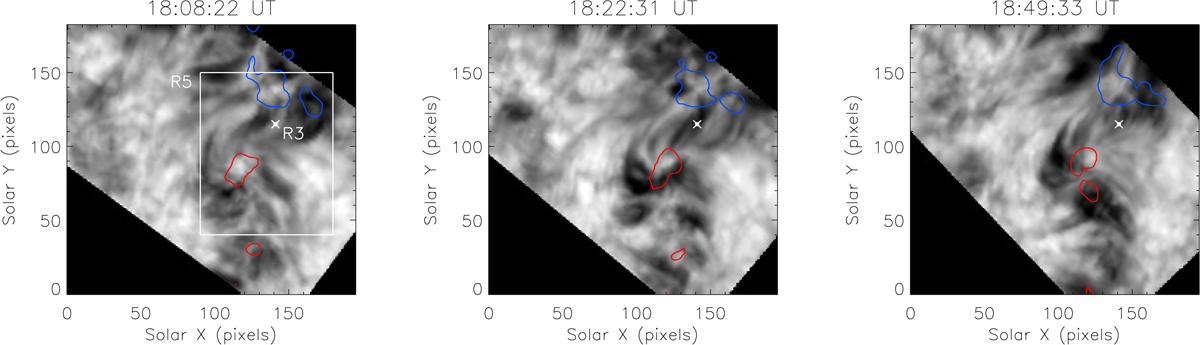
Hα images before (left), during (middle) and after (right) the heating episode with overplotted the ±50 G magnetic-field contours (red – positive polarity, blue – negative). The images are produced by summing the Hα intensity in the blue and red wings of Hα at ±0.45 Å. The large square denoted as R5 in the left panel is where the temporal variations from the whole CBP shown in Figs. 5 and 7 were obtained. A cross denotes R3, from which the temporal variations in one of the HLs were produced in Figs. 5 and 7. The pixel size is 0.16″.
Current usage metrics show cumulative count of Article Views (full-text article views including HTML views, PDF and ePub downloads, according to the available data) and Abstracts Views on Vision4Press platform.
Data correspond to usage on the plateform after 2015. The current usage metrics is available 48-96 hours after online publication and is updated daily on week days.
Initial download of the metrics may take a while.