Fig. 2.
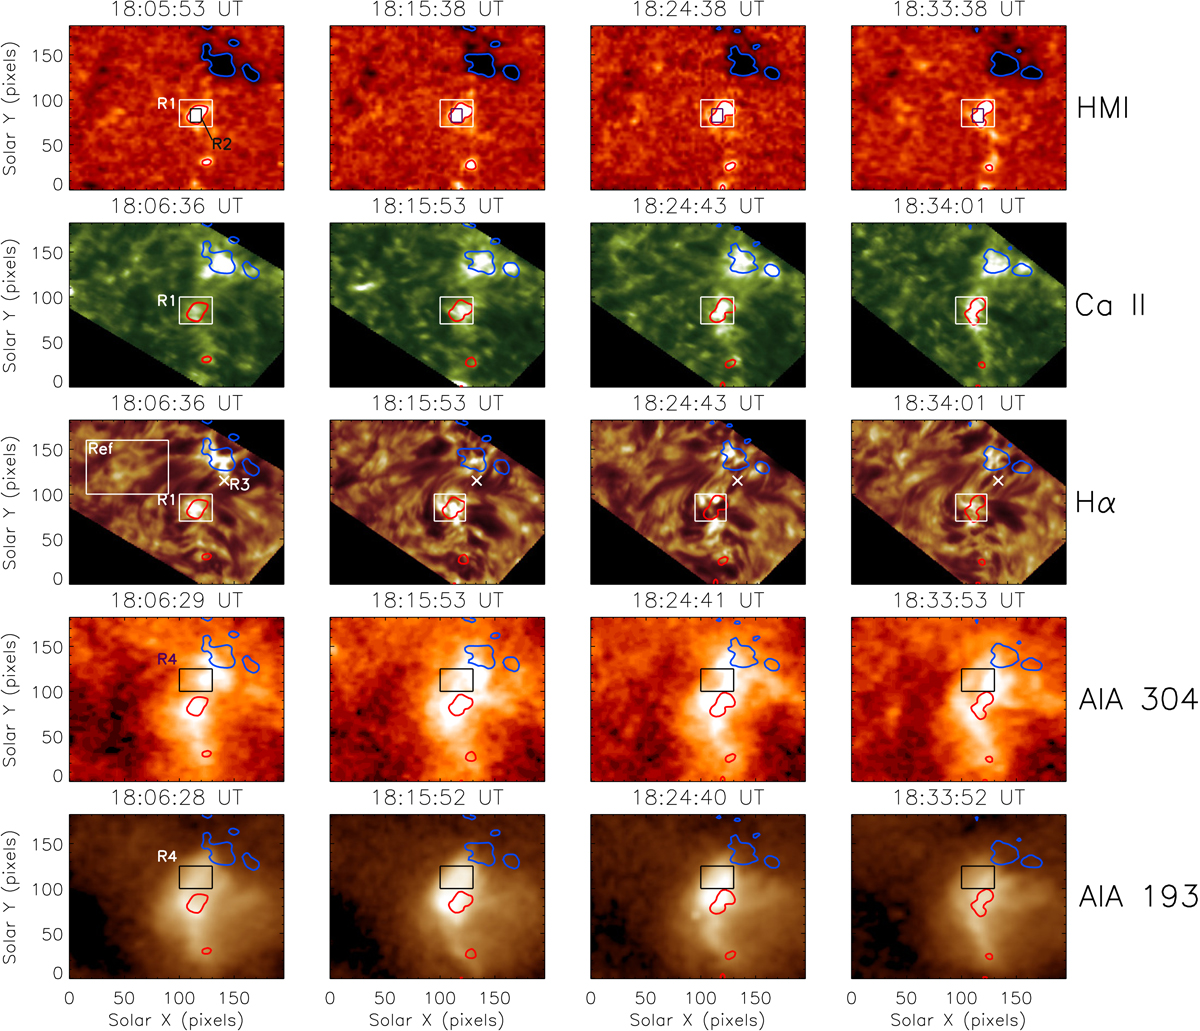
Multi-instrument images of the CBP. Top row: HMI line of sight magnetograms scaled from −50 to 50 G overplotted with a larger square noted as region of interest #1 (R1, also on the Hα and Ca II images), which outlines the area from which the temporal variations of various parameters in the south footpoint of the CBP were obtained. The smaller square denotes (R2) the area from which the hydrogen temperature was determined in Fig. 7. Second row: Ca II line-core intensity images overplotted with the ±50 G magnetic-field contours. Third row: Hα line-core intensity images with the same contours. The large square on the Hα image in the first column (Ref) is the area from which the reference Hα profile used to derive the Doppler velocities was obtained. The cross sign denotes the centre of a small area (R3) from which the temporal variations in an Hα loop were produced in Figs. 5 and 7. Fourth and fifth rows: AIA 304 and AIA 193 images overplotted with the ±50 G magnetic-field contours and a square (R4) that outlines the area from which the light curve in the CBP loops was produced for Figs. 5–7. The pixel size is 0.16″, that is the size of the images is 29″ × 31″.
Current usage metrics show cumulative count of Article Views (full-text article views including HTML views, PDF and ePub downloads, according to the available data) and Abstracts Views on Vision4Press platform.
Data correspond to usage on the plateform after 2015. The current usage metrics is available 48-96 hours after online publication and is updated daily on week days.
Initial download of the metrics may take a while.