Fig. A.2.
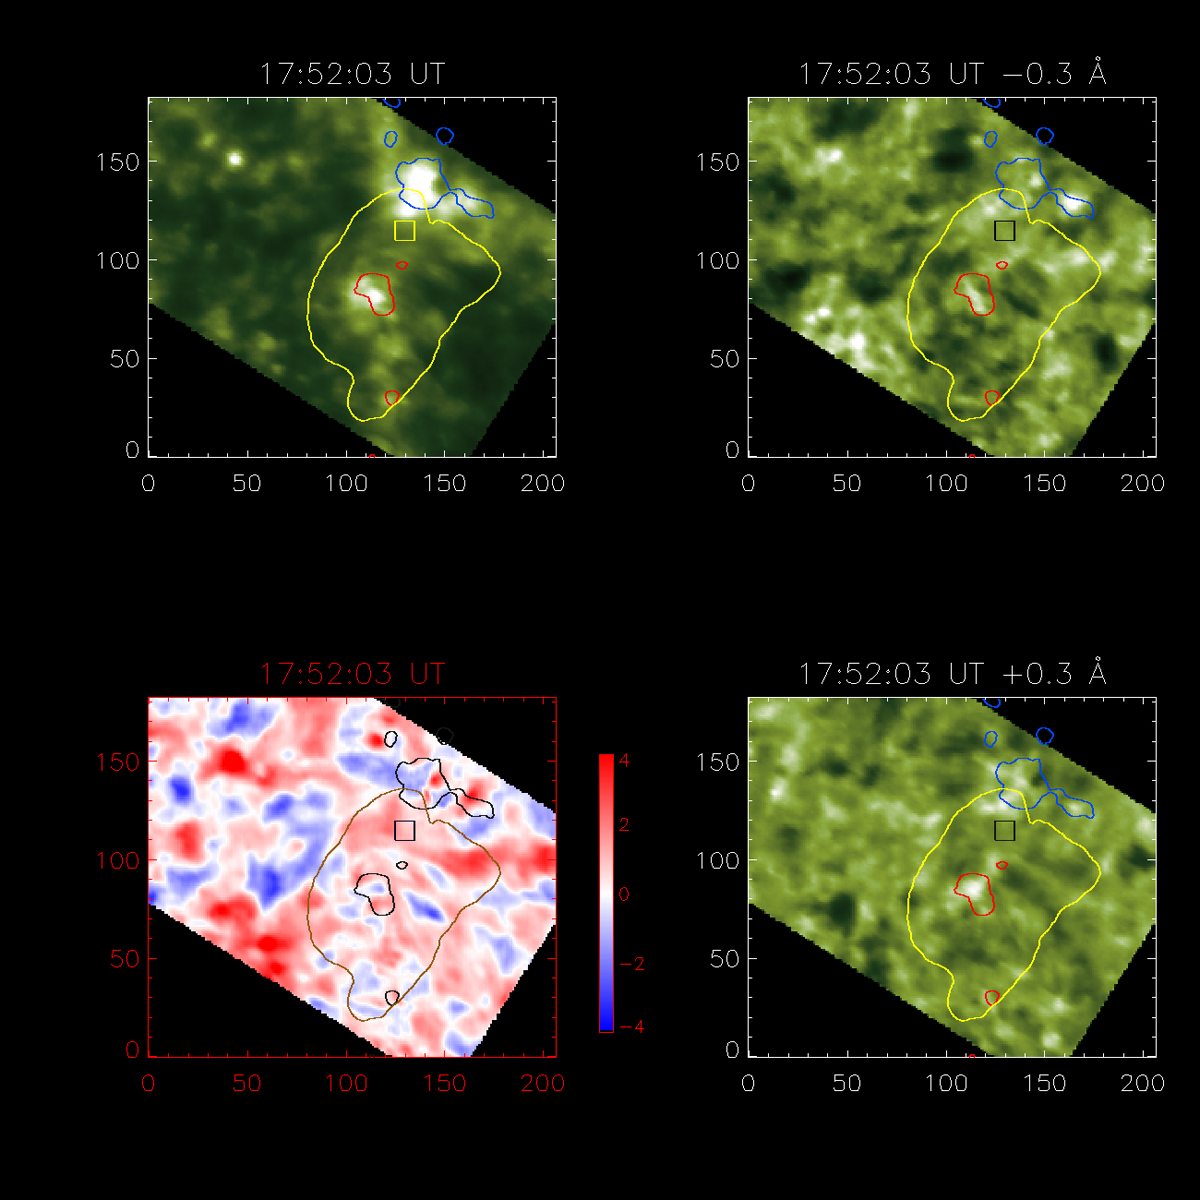
Animation of the following image sequences. Top row: Ca II line-core intensity image (left) and Ca II image at −0.3 Å (right). Bottom row: Doppler-shift image and Ca II image at 0.3 Å. The contour overplotted on all panels is the CBP AIA 193 intensity contour. The ±50 G magnetic-field contours (red – positive polarity; blue – negative). See online movie.
Current usage metrics show cumulative count of Article Views (full-text article views including HTML views, PDF and ePub downloads, according to the available data) and Abstracts Views on Vision4Press platform.
Data correspond to usage on the plateform after 2015. The current usage metrics is available 48-96 hours after online publication and is updated daily on week days.
Initial download of the metrics may take a while.