Fig. 10.
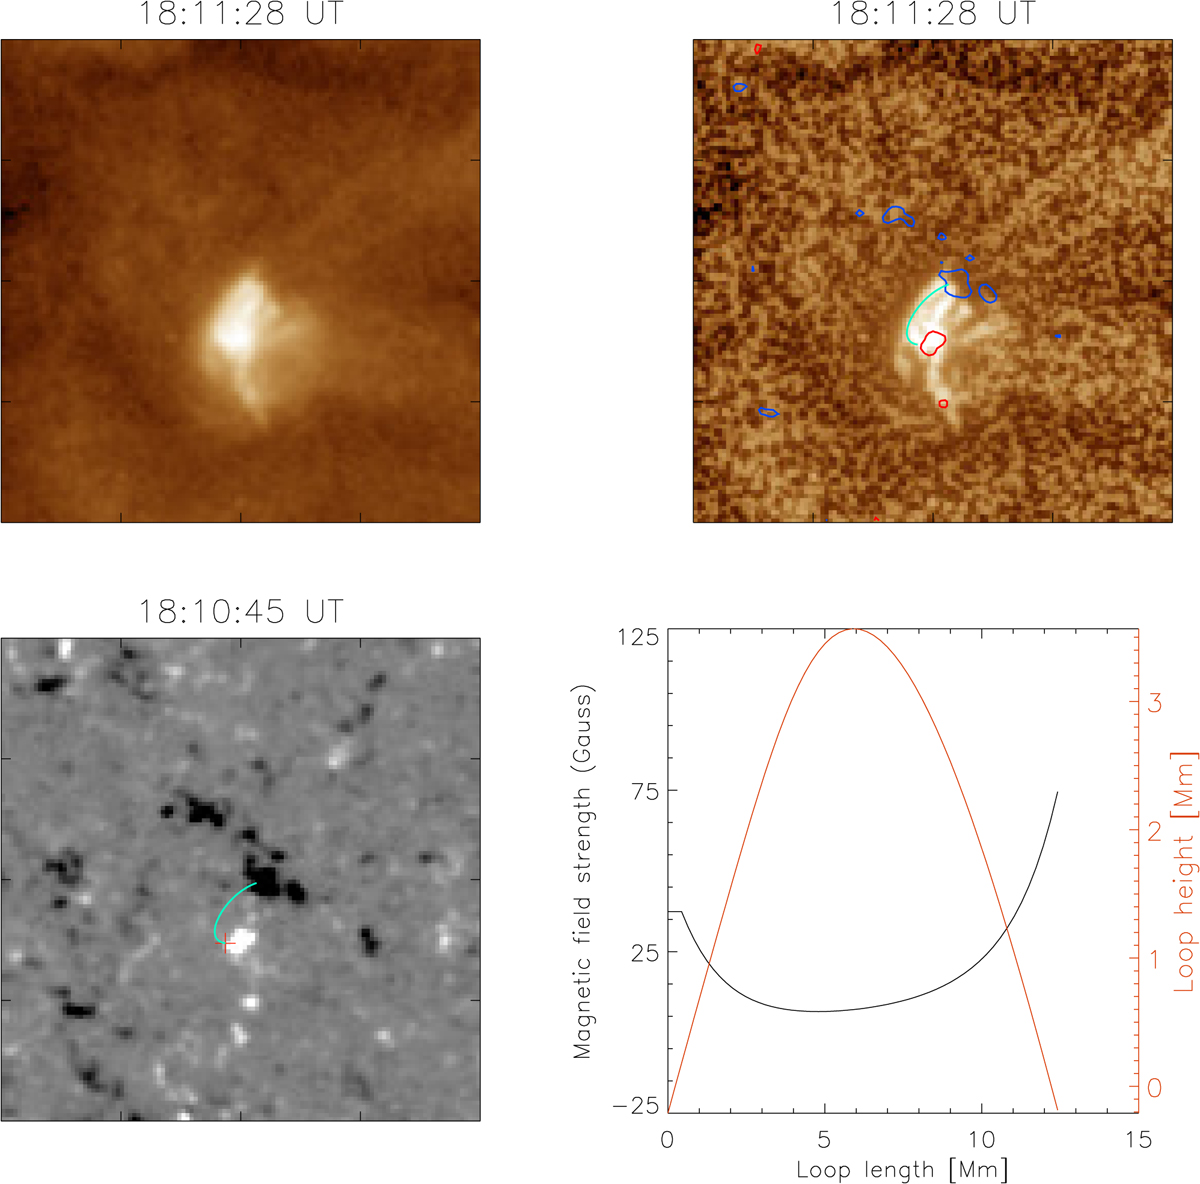
Linear force-free field extrapolation of a CBP loop. Top left: AIA 193 image. Top right: MGN processed AIA 193 image with overplotted a magnetic field line that matches one of the extrapolated CBP loops. Bottom left: HMI magnetogram with the same magnetic field line. The cross indicates the location from which the magnetic field line was traced. Bottom right: magnetic-field-line parameters.
Current usage metrics show cumulative count of Article Views (full-text article views including HTML views, PDF and ePub downloads, according to the available data) and Abstracts Views on Vision4Press platform.
Data correspond to usage on the plateform after 2015. The current usage metrics is available 48-96 hours after online publication and is updated daily on week days.
Initial download of the metrics may take a while.