Fig. 1.
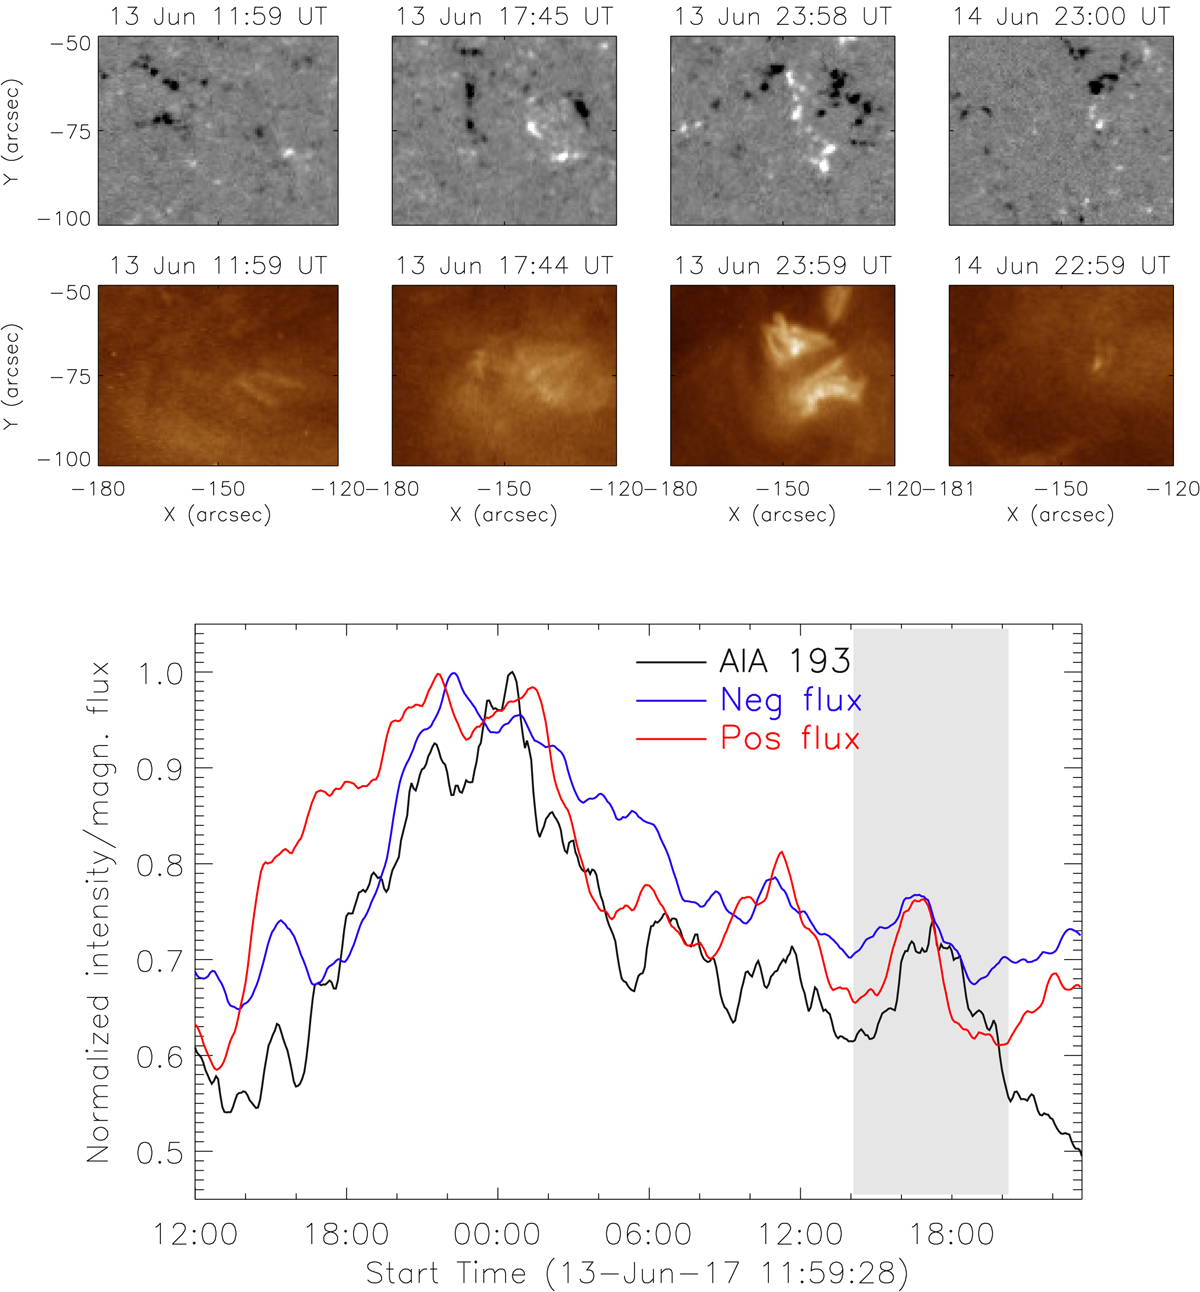
Temporal variation of the magnetic flux and AIA 193 intensity of the CBP along its full lifetime. Images at the top: HMI saturated at ±100 G (top row) and AIA 193 (bottom row). Bottom panel: AIA 193 intensity and LOS magnetic flux of the positive and negative polarities. Each curve is normalized to its maximum. The grey area highlights a period of magnetic flux and coronal emission increase, part of which is covered by the FISS data and is analysed here in detail.
Current usage metrics show cumulative count of Article Views (full-text article views including HTML views, PDF and ePub downloads, according to the available data) and Abstracts Views on Vision4Press platform.
Data correspond to usage on the plateform after 2015. The current usage metrics is available 48-96 hours after online publication and is updated daily on week days.
Initial download of the metrics may take a while.