Fig. 8.
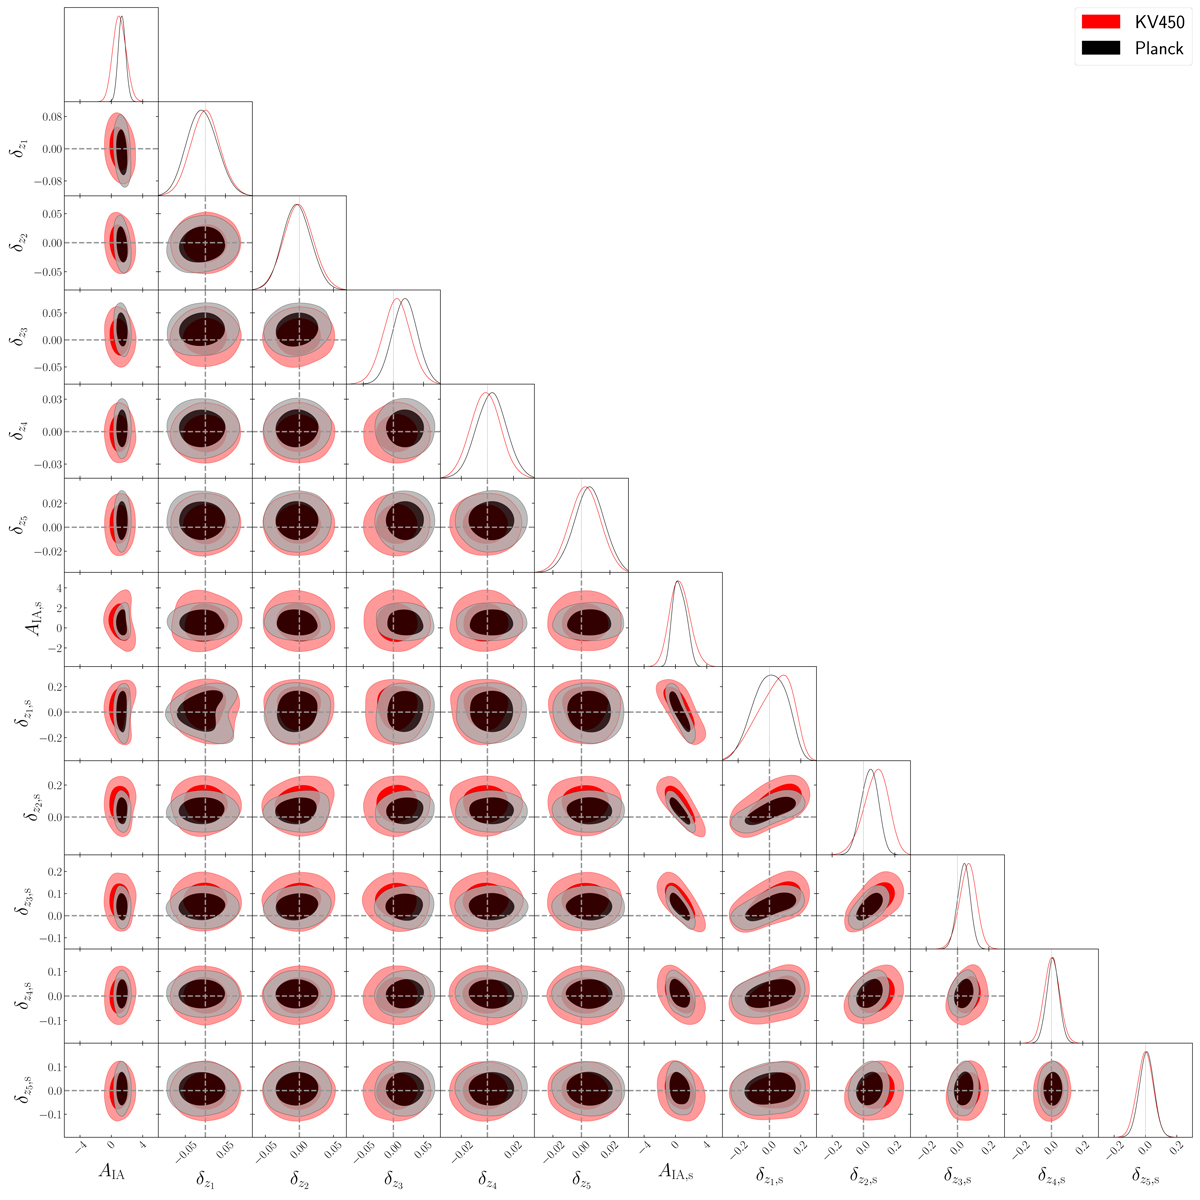
Contour plots of the 68% and 95% credible regions for all the free parameters in ℋ1 model. Plotting ranges are the same as the prior ranges. Dashed lines indicate zero values in the ideal case. Two different colours correspond to the two sets of results from KV450 and Planck cosmological values. The slight degeneracy between δzi, s in the low redshift bins is an effect from the high degeneracy between AIA, s and δzi, s. It vanishes in the test setting 𝒯1, where AIA, s is fixed to zero.
Current usage metrics show cumulative count of Article Views (full-text article views including HTML views, PDF and ePub downloads, according to the available data) and Abstracts Views on Vision4Press platform.
Data correspond to usage on the plateform after 2015. The current usage metrics is available 48-96 hours after online publication and is updated daily on week days.
Initial download of the metrics may take a while.