Fig. 5.
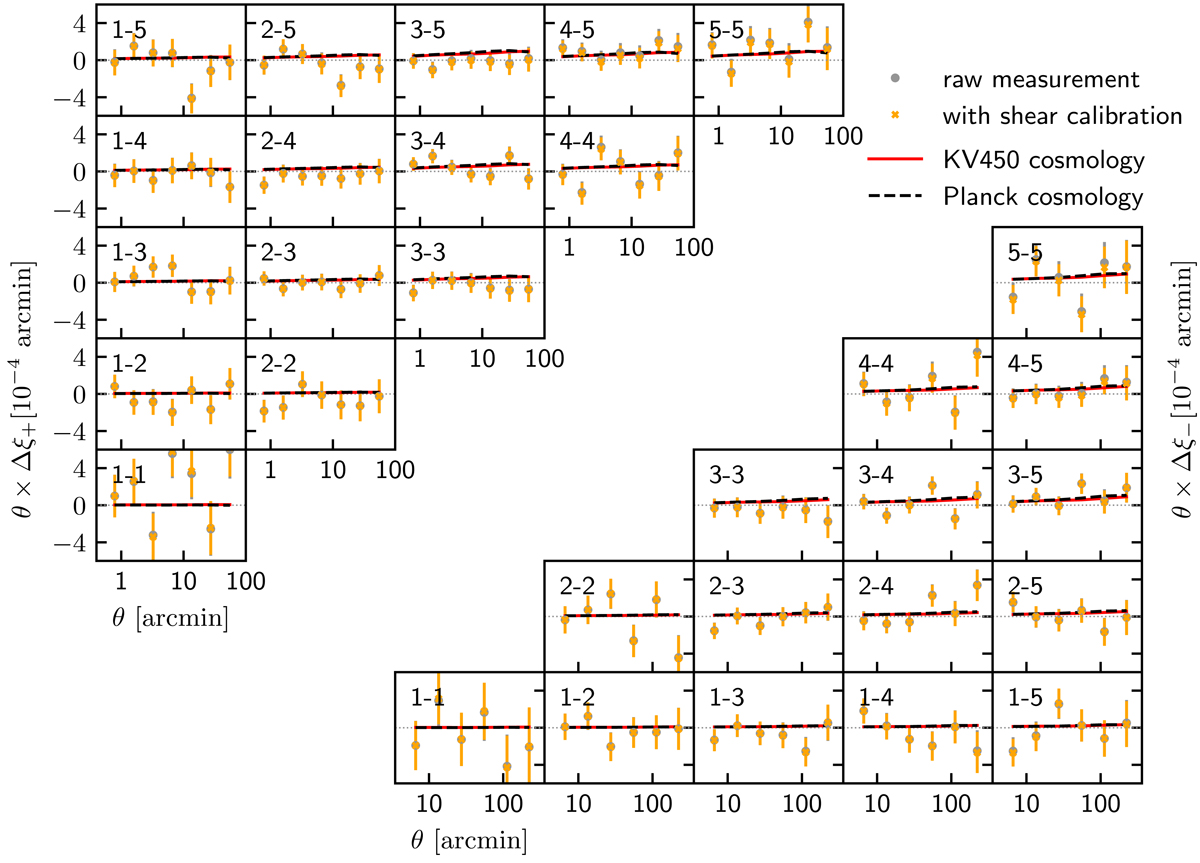
Difference between two-point shear correlation functions from the two sub-samples (![]() ). The errors shown are defined as
). The errors shown are defined as ![]() , where the subscript ‘D’ means the diagonal of a matrix, and the three unique parts of the whole covariance matrix are denoted as Cb for the blue sub-sample, Cr for the red sub-sample and Cbr for their cross-covariance. We found these errors are close to the measurement errors reported by the TREECORR code (σmeasure/σC ≳ 0.8), indicating that the diagonal elements of the covariance matrix are dominated by measurement noise. The overall agreement between the two sets of data vectors with and without the shear calibration (orange crosses vs. black dots) indicates the multiplicative bias has little effect in this study.
, where the subscript ‘D’ means the diagonal of a matrix, and the three unique parts of the whole covariance matrix are denoted as Cb for the blue sub-sample, Cr for the red sub-sample and Cbr for their cross-covariance. We found these errors are close to the measurement errors reported by the TREECORR code (σmeasure/σC ≳ 0.8), indicating that the diagonal elements of the covariance matrix are dominated by measurement noise. The overall agreement between the two sets of data vectors with and without the shear calibration (orange crosses vs. black dots) indicates the multiplicative bias has little effect in this study.
Current usage metrics show cumulative count of Article Views (full-text article views including HTML views, PDF and ePub downloads, according to the available data) and Abstracts Views on Vision4Press platform.
Data correspond to usage on the plateform after 2015. The current usage metrics is available 48-96 hours after online publication and is updated daily on week days.
Initial download of the metrics may take a while.