Fig. 9.
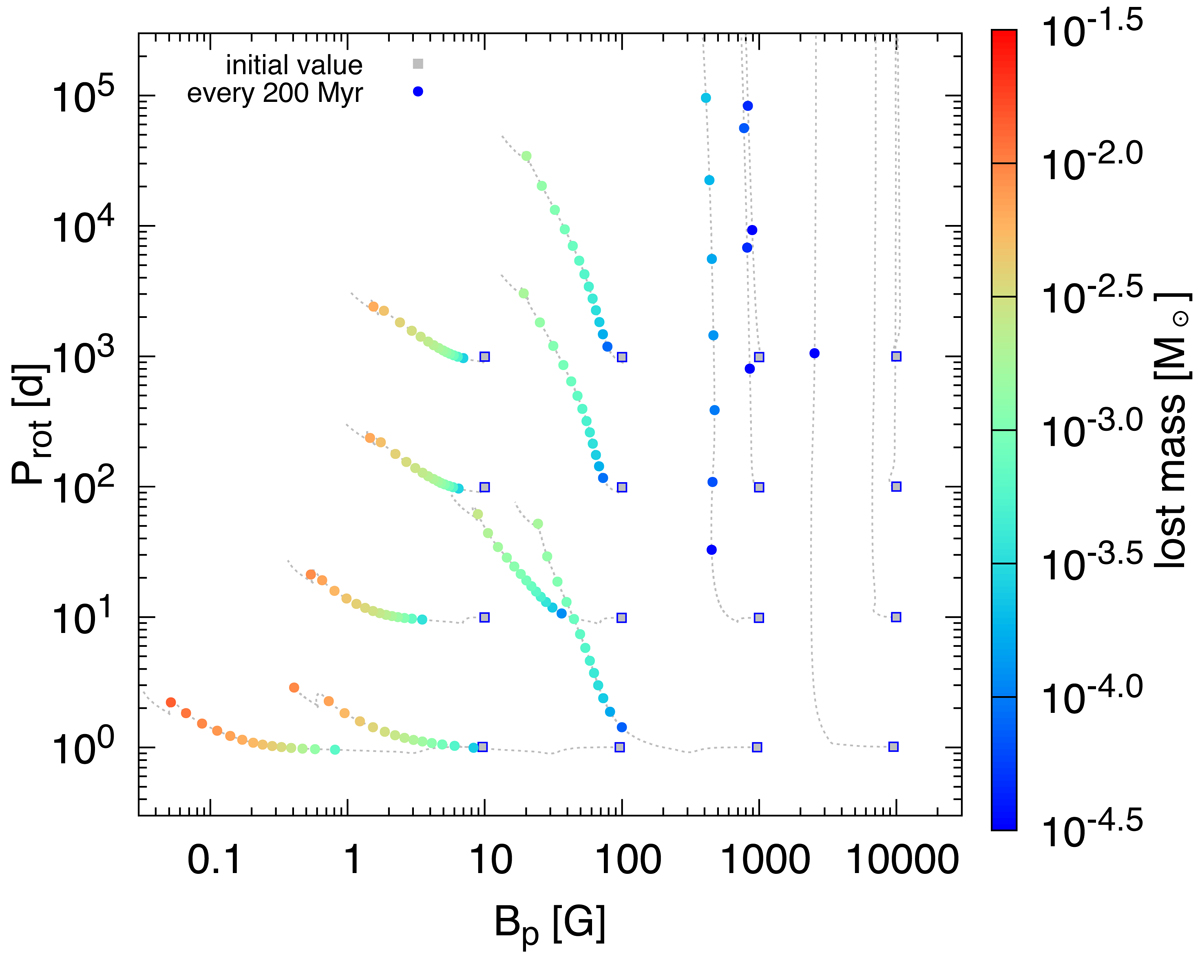
Surface rotation period (Prot) as function of the polar surface field strength (Bp) during the main-sequence evolution of our 1.5 M⊙ models. The corresponding ZAMS values are shown by gray squares with Bp = 10, 100, 1000, and 10 000 G and Prot = 1, 10, 100, and 1000 d. As evolution progresses, the models increase their rotation periods and decrease their magnetic field strengths as indicated by the gray dashed lines. Colored dots are placed on these evolutionary tracks every 200 Myr, with the color indicating the total amount of mass lost during the previous evolution (see color bar to the left). Kinks close to the last points in models with Bp, ini ≤ 100 G indicate the TAMS turnoff.
Current usage metrics show cumulative count of Article Views (full-text article views including HTML views, PDF and ePub downloads, according to the available data) and Abstracts Views on Vision4Press platform.
Data correspond to usage on the plateform after 2015. The current usage metrics is available 48-96 hours after online publication and is updated daily on week days.
Initial download of the metrics may take a while.