Fig. 5.
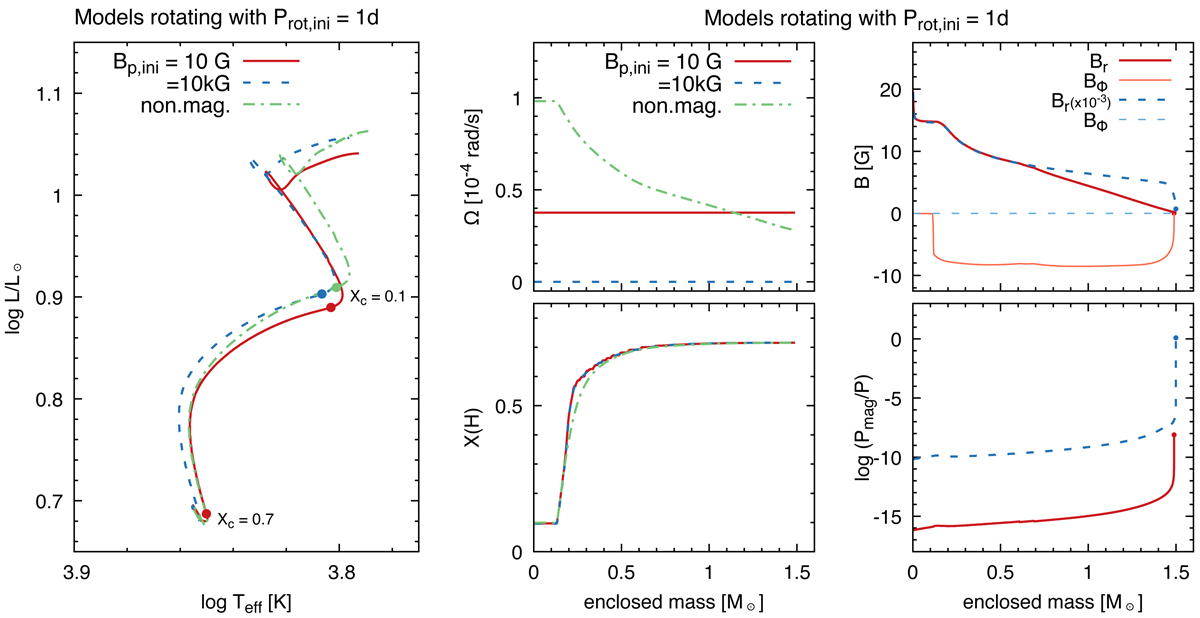
Left panel: main-sequence evolution of 1.5 M⊙ models in the HR diagram, computed with ncv = 0 and Prot, ini = 1 d. The result of magnetic models with an initial magnetic field strength of Bp, ini = 10 G and 10 kG are shown by the red solid and blue dashed lines, while the result of the nonmagnetic model is shown by the green dash-dotted line. Epochs for which the central hydrogen become Xc = 0.1 (and 0.7 for the Bp, ini = 10 G model) are indicated by dots. Right panels: profiles of internal angular velocity (top left), radial and toroidal magnetic field strength (top right), hydrogen mass fraction (bottom left), and the ratio between the magnetic pressure and the pressure (bottom right) at Xc = 0.1 as a function of Lagrangian mass coordinate. Again, profiles of the Bp, ini = 10 G and 10 kG models are shown by the red solid and the blue dashed lines, while that of the nonmagnetic model are by the green dash-dotted lines. Top right panel: radial and toroidal field strength are shown by the thick and thin lines, respectively, and the radial component for the Bp, ini = 10 kG model is multiplied with a factor of 10−3. The surface values are highlighted by dots in the right-top and right-bottom panels.
Current usage metrics show cumulative count of Article Views (full-text article views including HTML views, PDF and ePub downloads, according to the available data) and Abstracts Views on Vision4Press platform.
Data correspond to usage on the plateform after 2015. The current usage metrics is available 48-96 hours after online publication and is updated daily on week days.
Initial download of the metrics may take a while.