Fig. 2.
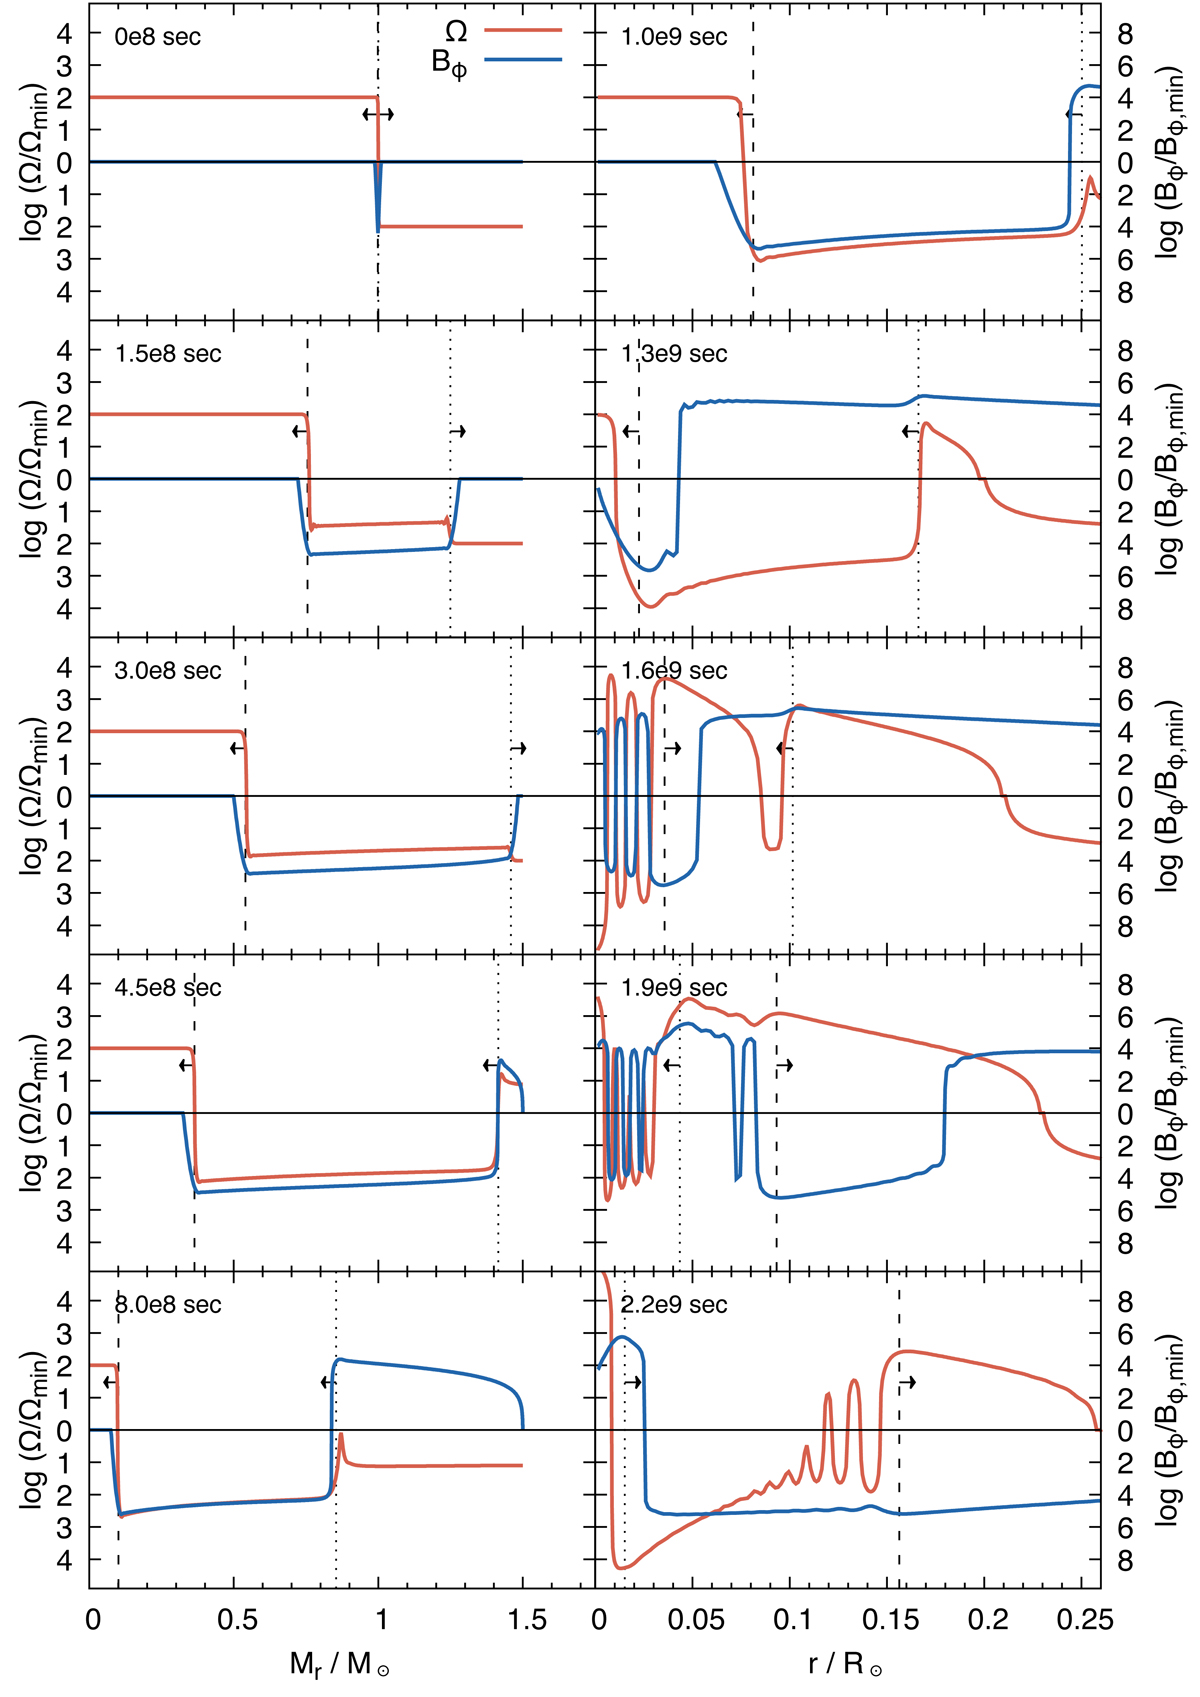
Angular velocity, Ω (red lines), and strength of the ϕ-component of the magnetic field, Bϕ (blue lines), for ten different times during the evolution of a 1.5 M⊙ main-sequence stellar model, illustrating the propagation of torsional Alfvén waves in the stellar interior. Here, the Ω effect and the Maxwell stress are taken into account, but the η effect is not. The x-axis for the left panels, showing times up to 8 × 10⁸ s, is the Lagrangian mass coordinate, the right panels, depicting later times, use the radius coordinate. On the y-axis, The logarithm of Ω divided by Ωmin (or log Bϕ, min/Bϕ, min) is plotted with the normalization values of Ωmin = 1 × 10⁻⁶ rad s−1 and Bϕ, min = 1 × 10³ G. Prograde rotation and positive B-field polarity are plotted in the upper half of the panels, retrograde rotation and negative polarity are plotted in the lower half. Small structure with −Ωmin < Ω < Ωmin and −Bϕ, min < Bϕ < Bϕ, min is omitted from this plot. The black dashed and black dotted lines show the positions of the wavefronts, rf, which are estimated by Eq. (45). Arrows indicate the direction of the wave propagation.
Current usage metrics show cumulative count of Article Views (full-text article views including HTML views, PDF and ePub downloads, according to the available data) and Abstracts Views on Vision4Press platform.
Data correspond to usage on the plateform after 2015. The current usage metrics is available 48-96 hours after online publication and is updated daily on week days.
Initial download of the metrics may take a while.