Fig. 11.
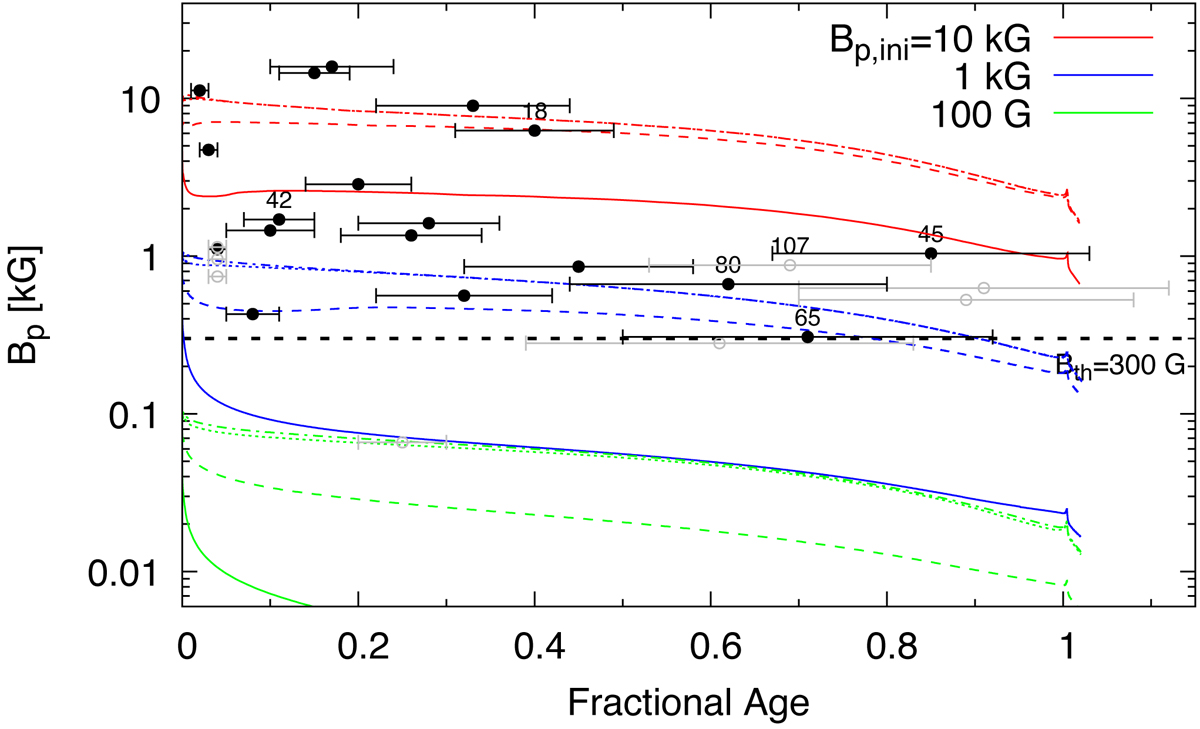
Comparison of the surface magnetic field evolution of our 1.5 M⊙ models and observational results for 2−3 M⊙ Ap stars analysed by Landstreet et al. (2007, 2008). Our models with Bp, ini = 10 kG, 1 kG, and 100 G are shown by red, blue, and green lines, respectively (see legend). Similar as in Fig. 8, solid, dashed, dotted, and dash-dotted lines indicate initial periods of Prot, ini of 1, 10, 100, and 1000 d, respectively. Dots with error bars correspond to observed stars, where black filled symbols show stars for which a field is detected, while gray open symbols are probable magnetic stars. Numbers associated with several stars denote V sin i in units of km s−1. The threshold magnetic field of Bth ∼ 300 G, below which essentially no Ap/Bp stars are found (Aurière et al. 2007), is shown by the black dashed line. A numerical factor of 3.3 is multiplied to the field strengths reported in the literature to convert Brms into Bp.
Current usage metrics show cumulative count of Article Views (full-text article views including HTML views, PDF and ePub downloads, according to the available data) and Abstracts Views on Vision4Press platform.
Data correspond to usage on the plateform after 2015. The current usage metrics is available 48-96 hours after online publication and is updated daily on week days.
Initial download of the metrics may take a while.