Fig. 10.
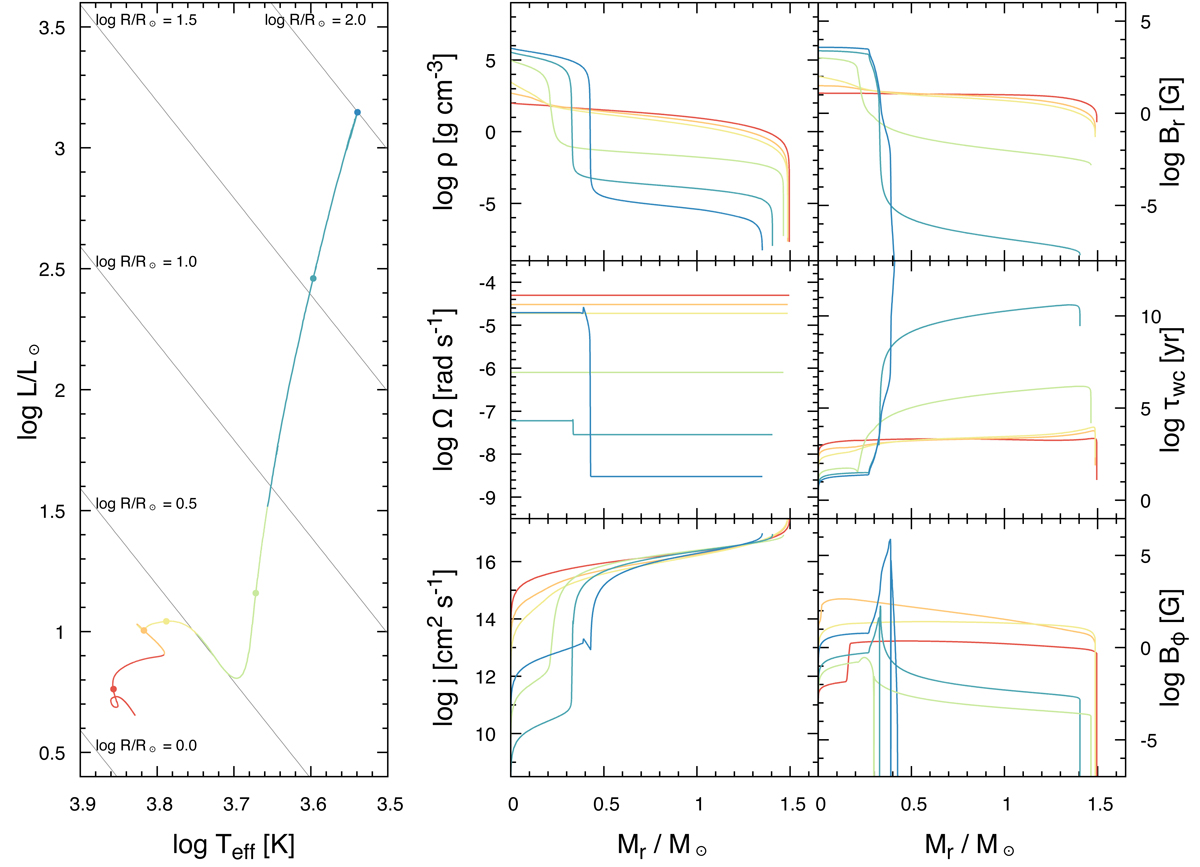
Left panel: evolution of a 1.5 M⊙ magneto-rotating model in the HR diagram, computed with ncv = 0. The line colors indicate the different evolutionary phases. Grey lines are iso-radius lines for log R/R⊙ = 0.0, 0.5, 1.0, 1.5, and 2.0. Right panels: profiles of internal density (top left), radial field strength (top right), rotation frequency (middle left), local wave-crossing time (middle right), specific angular momentum (bottom left), and toroidal field strength (bottom right) as a function of the Langrangian mass coordinate. Left panel: six epochs for which profiles are shown in the right panels are indicated by colors and dots that have the same color as the profiles.
Current usage metrics show cumulative count of Article Views (full-text article views including HTML views, PDF and ePub downloads, according to the available data) and Abstracts Views on Vision4Press platform.
Data correspond to usage on the plateform after 2015. The current usage metrics is available 48-96 hours after online publication and is updated daily on week days.
Initial download of the metrics may take a while.