| Issue |
A&A
Volume 646, February 2021
|
|
|---|---|---|
| Article Number | A174 | |
| Number of page(s) | 12 | |
| Section | Extragalactic astronomy | |
| DOI | https://doi.org/10.1051/0004-6361/202039227 | |
| Published online | 22 February 2021 | |
Environments of a sample of AzTEC submillimetre galaxies in the COSMOS field
1
Department of Physics, University of Zagreb, Bijenika Cesta 32, 10000 Zagreb, Croatia
2
European Space Agency (ESA), European Space Astronomy Centre (ESAC), Camino Bajo del Castillo s/n, 28692 Villanueva de la Cañada, Madrid, Spain
e-mail: This email address is being protected from spambots. You need JavaScript enabled to view it.
3
Department of Physics, University of Helsinki, Gustaf Hällströmin Katu 2, 00014 Helsinki, Finland
4
Geneva Observatory, University of Geneva, Ch. des Maillettes 51, 1290 Versoix, Switzerland
5
Núcleo de Astronomía de la Facultad de Ingeniería y Ciencias, Universidad Diego Portales, Av. Ejército Libertador 441, Santiago, Chile
Received:
21
August
2020
Accepted:
21
December
2020
Abstract
Aims. Submillimetre galaxies (SMGs) are bright sources at submillimetre wavelengths (F850 μm > 2−5 mJy). Made up of mostly of high-z galaxies (z > 1), SMGs are amongst the most luminous dusty galaxies in the Universe. These galaxies are thought to be the progenitors of the massive elliptical galaxies in the local Universe and to reside in massive haloes at early epochs. Studying their environments and clustering strength is thus important to put these galaxies in a cosmological context.
Methods. We present an environmental study of a sample of 116 SMGs in 96 ALMA observation fields, which were initially discovered with the AzTEC camera on ASTE and identified with high-resolution 1.25 mm ALMA imaging within the COSMOS survey field, having either spectroscopic or unambiguous photometric redshift. We analysed their environments making use of the latest release of the COSMOS photometric catalogue, COSMOS2015, a catalogue that contains precise photometric redshifts for more than half a million objects over the 2 deg2 COSMOS field. We searched for dense galaxy environments computing the so-called overdensity parameter as a function of distance within a radius of 5′ from the SMG. We validated this approach spectroscopically for those SMGs for which spectroscopic redshift is available. As an additional test, we searched for extended X-ray emission as a proxy for the hot intracluster medium, performing an X-ray stacking analysis in the 0.5−2 keV band with a 32″ aperture and our SMG position using all available XMM-Newton and Chandra X-ray observations of the COSMOS field.
Results. We find that 27% (31 out of 116) of the SMGs in our sample are located in a galactic dense environment; a fraction that is similar to previous studies. The spectroscopic redshift is known for 15 of these 31 sources, thus this photometric approach is tested using spectroscopy. We are able to confirm that 7 out of 15 SMGs lie in high-density peaks. However, the search for associated extended X-ray emission via an X-ray stacking analysis leads to a detection that is not statistically significant.
Key words: galaxies: clusters: general / galaxies: evolution / galaxies: formation / galaxies: groups: general / galaxies: starburst
© ESO 2021
1. Introduction
Submillimetre galaxies (SMGs) are amongst the most luminous dusty galaxies in the Universe (Wilkinson et al. 2017), which emit most of their energy at submillimetre (sub-mm) wavelengths, from 200 μm to about 1 mm (Geach et al. 2017). They were initially discovered in extragalactic submillimetre surveys using the Submillimetre Common-User Bolometer Array (SCUBA; Holland et al. 1999; Barger et al. 1998; Hughes et al. 1998). These galaxies are highly star forming, reaching star formation rates (SFRs) up to thousands of M⊙ yr−1 (see e.g., Casey et al. 2014; Rowan-Robinson et al. 2018). The bulk of this population has a redshift distribution that ranges between z ∼ 2 and 3 with a tail reaching up to z ∼ 5 (Strandet et al. 2016; Brisbin et al. 2017; Stach et al. 2019). At these high redshifts, SMGs are found to generate a significant fraction of the energy release of all galaxies at such distances. Most of their radiation comes from thermal continuum emission from dust grains from the interstellar medium (ISM) heated by a population of optically obscured young massive stars (for a review see Blain et al. 2002).
Galaxy clusters are the largest gravitationally bound systems in the Universe and are usually located at the knots of the filamentary large-scale structures. These clusters are typically composed of 30 to 100 s of galaxies, with total masses up to 1015 M⊙ and sizes of around 1 Mpc (see e.g., Bahcall 1996). Their progenitors are proto-clusters, which are structures found at redshifts 2 < z < 7 that extend over tens of Mpc forming a structure that eventually coalesces into a galaxy cluster (see e.g., Springel et al. 2005; Overzier et al. 2009). Proto-clusters are rare and difficult to observe, although some observational efforts have been made to search, identify, and characterise them (see e.g., Ouchi et al. 2005; Galametz et al. 2010; Toshikawa et al. 2012). The detection of proto-clusters is important to understand hierarchical structure formation and stellar mass growth in galaxies at early times.
Most likely, SMGs are the progenitors of massive elliptical galaxies observed in the local universe (see e.g., Lilly et al. 1999; Fu et al. 2013; Toft et al. 2014). Since early-type galaxies are predominantly found in clusters, it is important to address the question of whether SMGs are preferably found in regions with enhanced galaxy density. Studying the clustering properties of SMGs can also provide constraints on their nature in a cosmological context. Some models depict SMGs as a long-lived episode of star formation in the most massive galaxies, driven by the early fast collapse of the dark matter halo (Xia et al. 2012), yielding strong clustering for these sources. On the other hand, other models in which SMGs are short-lived bursts in less massive galaxies, predict weaker clustering (Almeida et al. 2011). So far, most of the studies on the environments of SMGs have been done in individual sources or small samples (Ivison et al. 2000; Scott et al. 2002; Aravena et al. 2010; Oteo et al. 2018; Hill et al. 2020), which has not really allowed us to test the abundance of structures around these galaxies and has forbidden clustering measurements.
The Cosmic Evolution Survey (COSMOS; Scoville et al. 2007) includes multiwavelength imaging and spectroscopy from X-ray to radio wavelengths over an area of 1.4 × 1.4 deg at a sufficient depth to provide a comprehensive view of galaxy formation and large-scale structure. In this work we aim to improve the clustering measurements of SMGs by extending the current statistical sample. We evaluate overdensities of a sample of 116 SMGs in the COSMOS field that were initially discovered with the AzTEC camera on the Atacama Submillimeter Telescope Experiment (ASTE; Aretxaga et al. 2011), and subsequently identified with high-resolution 1.25 mm ALMA imaging in 96 different fields (Brisbin et al. 2017).
This paper is organised as follows. In Sect. 2 we introduce our SMG sample and the COSMOS catalogues used for the environmental study. In Sect. 3 we describe the methodology used to measure the overdensities and their significance and false detection rate. In Sect. 4 we present the results of our analysis. Then in Sect. 5 we verify the overdensities using spectroscopic redshift. Later in Sect. 6 we discuss our results comparing them to what previously found in the literature, and finally in Sect. 7 we present our conclusions.
Unless otherwise stated, we assume a flat ΛCDM cosmology with a Hubble constant H0 = 73 km s−1 Mpc−1, total matter density Ωm = 0.27, and dark energy density ΩΛ = 0.73 (Spergel et al. 2007; Larson et al. 2011). Magnitudes throughout this paper refer to the AB magnitude system (Oke 1974).
2. Data
2.1. SMG sample
The sources studied in this work are the so-called “strict” subsample from Brisbin et al. (2017). These 116 SMGs have been detected using high spatial resolution (∼1″) targeted observations in cycle 2 ALMA operations of 96 fields within the COSMOS survey, designed to include a sample of AzTEC/ASTE sources with 1.1 mm flux densities ≥1 mJy (Aretxaga et al. 2011). For this work we use those sources that are defined as the “strict” sample, for which either spectroscopic or unambiguous photometric redshift is determined. The median redshift of this sample is  = 2.3 ± 0.6.
For 30 SMGs the spectroscopic redshift is available. Seven of these values were calculated using CO measurements (AzTEC/C1a, C2a, C3a, C5, C6a, C6b, and C17), and the rest were taken from the COSMOS spectroscopic redshift catalogue (available internally for members of the COSMOS collaboration). For those sources with photometric redshift, they were measured by Brisbin et al. (2017) cross correlating the ALMA positions with the latest release of the COSMOS photometric catalogue, COSMOS2015.
The complete list of SMGs is given in Table A.1 of Brisbin et al. (2017). Throughout this paper we use the nomenclature given by these authors; for alternative names, see the second column of their Table A.1. Of these 96 different ALMA observations, 19 are multiple component observation fields, meaning there are several resolved SMGs inside each field. The 39 SMGs belonging to multi-component systems are described by an alphabetical tag in descendant order of brightness for each observing field. Some of these sources are physically related, while others belong to the same ALMA observation only as a result of chance alignment. This is explored in more detail in Sect. 6.1.
2.2. Catalogues
To study the environments of SMGs, we made use of the latest version of the COSMOS1 photometric catalogue (COSMOS2015 hereafter; Laigle et al. 2016). This catalogue includes photometric measurements from the ultraviolet (UV) to the infrared (IR) wavelengths, including 6 broad optical bands (B, V, g, r, i, z++), 12 medium bands, and 2 narrow bands, as well as Y, J, H, and KS data from the UltraVISTA Data Release 2 new HyperSuprime-Cam Subaru Y band and new SPLASH 3.6 and 4.5 μm Spitzer/Infrared Array Camera (IRAC) data (Sanders et al. 2007; Capak et al. 2007; McCracken et al. 2012; Ilbert et al. 2013).
Furthermore, we used a catalogue of spectroscopic redshifts in the COSMOS field available internally for members of the COSMOS collaboration. It is composed of 36 274 spectroscopic redshifts, both available only internally to the COSMOS collaboration and from the following surveys:
1. The zCOSMOS-bright survey contributed 8608 galaxies at 0.1 ≤ z ≤ 1.2 performed with the VIsible Multi-Object Spectrograph (VIMOS) at the Very Large Telescope (VLT) covering the entire COSMOS field (Lilly et al. 2007, 2009).
2. The zCOSMOS-deep survey for fainter sources, contributing 767 galaxies with secure redshifts at 1.4 ≤ z ≤ 3.0 and covering the central 1 deg2 of the COSMOS field (Lilly et al., in prep.).
3. The 6617 galaxies with high- quality spectra from the DEIMOS 10 K Spectroscopic Survey Catalog of the COSMOS Field, which is a survey that samples a broad redshift distribution in up to z = 6 (Hasinger et al. 2018).
4. The 2022 galaxies observed through multi-slit spectroscopy with the Deep Imaging Multi-Object Spectrograph (DEIMOS) on the Keck II telescope, having a broad redshift distribution 0.02 < z < 6 (Kartaltepe et al. 2010).
5. A number of 998 galaxies from VIMOS Ultra Deep Survey (VUDS), a spectroscopic redshift survey of very faint galaxies that covers the central 1 deg2 of the COSMOS field at 2 < z < 6 (Le Fèvre et al. 2015; Tasca et al. 2017).
6. A catalogue based on [OII] flux-calibrated spectroscopy of a total of 788 galaxies at 0.1 < z < 1.65, obtained with the VLT/FORS-2 instrument (Comparat et al. 2015).
7. The spectroscopic survey of galaxies in the COSMOS field using the Fiber Multi-object Spectrograph (FMOS), a near-IR instrument on the Subaru Telescope at 1.34 ≤ z ≤ 1.73 contributed 178 galaxies (Silverman et al. 2015).
8. The COSMOS field from the MOSFIRE Deep Evolution Field (MOSDEF) survey at 0.8 ≤ z ≤ 3.71 contributed 80 galaxies (Kriek et al. 2015).
9. A sample of 26 galaxies at 0.82 ≤ z ≤ 1.50 observed via near-IR spectroscopy with Subaru-FMOS and selected from a sample of IR luminous galaxies (Roseboom et al. 2012).
10. Wide Field Camera 3 (WFC3) of the Hubble Space Telescope grism spectroscopy and imaging for a sample of 11 galaxies at 1.88 ≤ z ≤ 2.54 (Krogager et al. 2014).
11. The X-shooter spectrograph at the VLT at 1.98 ≤ z ≤ 2.48 observed 14 galaxies (Zabl et al. 2015).
12. Near-IR spectroscopic observations of 10 passive galaxies with Subaru-MOIRCS at 1.24 ≤ z ≤ 2.09 (Onodera et al. 2012).
The COSMOS2015 photometric redshift accuracy was estimated by Smolčić et al. (2017) to test whether photometric redshifts could be efficiently used to search for overdensities and especially at high redshifts (z > 3.5), where the photometric redshift uncertainty is higher than lower redshifts. These authors performed a comparison study between the COSMOS2015 and the COSMOS spectroscopic redshift catalogue by measuring the distribution of Δz/(1 + zspec), where Δz is the difference between the spectroscopic and photometric redshifts. They find the standard deviation of the distribution to be σΔz/(1 + zspec) = 0.0067 for zphot ≤ 3.5 and σΔz/(1 + zspec) = 0.0155 for zphot > 3.5, verifying a good photometric redshift accuracy.
3. Methodology
3.1. Overdensity parameter
To search for overdensities in the SMG fields, we use the galaxies in the COSMOS2015 photometric catalogue that lie within the redshift range zphot = zSMG ± 3σΔz/(1 + zSMG)(1 + zSMG) from each SMG, being σΔz/(1 + zspec) = 0.0067 for zphot ≤ 3.5 and σΔz/(1 + zspec) = 0.0155 for zphot > 3.5. This interval is selected large enough to account for the uncertainties of the photometric sources.
First we compute the galaxy overdensity parameter to all those sources from the COSMOS2015 photometric catalogue within a distance of  , and 5′ from the position of the central SMG and in the above-mentioned redshift range. The galaxy overdensity parameter is defined as a function of radius as
 (1)
(1)
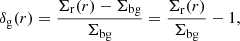
where Σr is the local galaxy surface density calculated as Σr = Nr/Ar, where Nr is the number of galaxies within the given radius and redshift bin in a search window area of Ar = π × r2. Correspondingly, Σbg is the background galaxy surface density and is defined as Σbg = Nbg/Abg. The quantity Nbg is the number of galaxies satisfying the photometric redshift interval within the entire area Abg of the COSMOS field, to take masked areas due to saturated stars and/or corrupted data into account. Conforming to this definition, δg(r) > 0 corresponds to an overdensity and δg(r) < 0 means an underdense region.
3.2. Significance and false detection rate
The probability of observing ≥Nr objects when the expected number is nr = Σbg × Ar is analytically defined by the Poisson distribution  . We calculate the significance of the overdensity parameter by computing the Poisson probability for each different radius and the value δg(r) is considered as robust when p ≤ 0.05.
Furthermore, we estimate the false detection rate by generating 10 mock catalogues for each SMG at a certain zSMG by randomly shifting their positions over the inner 1 deg2 of the COSMOS field. For each one of these mock catalogues that correspond to a certain SMG at zSMG, we generate other 1000 mock catalogues by randomly distributing in the sky the number of galaxies at zphot = zSMG ± 3σΔz/(1 + zSMG)(1 + zSMG) in the COSMOS2015 photometric catalogue, leading to 10 000 mock catalogues for each SMG. The false detection probability is given by the fraction of events in which Nr are found within a radius r over these 10 000 mock catalogues.
4. Analysis and results
4.1. Overdensity parameter
The results from our overdensity analysis are represented in Fig. A.1. For each SMG we show the overdensity parameter δg as function of the projected radius r measured from the central SMG, from 0.1′ up to 5′. For each point we indicate the number of sources Nr within the given radius, including the SMG. When the value of δg has a Poisson probability p(≥Nr, nr) ≤ 0.05, that point is enclosed in a square.
A SMG is considered to reside in an overdensity given at least one the following conditions: First, the probability of observing ≥Nr objects defined analytically by a Poisson distribution within a radius r is p ≤ 0.05 (see Sect. 3.2). Second, the false detection probability PFD (calculated numerically using mock catalogues at random SMG positions) of finding a number of sources ≥Nr within a radius r is ≤5% (see Sect. 3.2).
To evaluate the significance of δg, we start by the smallest considered radius  . If p(≥Nr, nr) and PFD > 5% for that radius, we continue to evaluate δg at the following values of the radius up to r = 5′. Table 1 shows those SMGs found in high-density peaks according to the above conditions. We find 31 SMGs out of the total 116 sample (∼27%) located in a significant overdensity, and nearly half of these (15 of 31) belong to the spectroscopic sample.
SMGs found in an overdensity.
We compare the redshift distributions of the sources located in an overdensity and non-overdensity environments in Fig. 1. A Kolmogorov–Smirnov (K-S) test (Peacock 1983; Fasano & Franceschini 1987) shows no significant difference at a 95% confidence level. The physical distances corresponding to the radius of the overdensities as reported in the second column of Table 1 vary from 232 pkpc at the zmin = 0.829, 251 pkpc at zmean = 2.410 and 199 pkpc at zmax = 4.772.
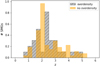 |
Fig. 1. Redshift distribution of the SMGs found in a significant overdensity (in grey, dashed) and those that are not found in a high-density environment (in orange, solid). There is no significant difference between their redshift distribution at a 95% confidence level according to the K-S test. |
4.2. Extended X-ray emission
X-ray extended emission is an evidence of hot intergalactic medium in clusters of galaxies. Hence, we search for extended X-ray emission around the SMGs positions. The entire COSMOS region has been mapped through 54 overlapping XMM-Newton pointings and additional Chandra observations (Elvis et al. 2009; Civano et al. 2016) and previous efforts have been made to search for X-ray emitting galaxy clusters in this field (Hasinger et al. 2007; Finoguenov et al. 2007; George et al. 2011).
In this work we first cross matched the positions of our SMGs with the revised catalogue of extended X-ray sources in the COSMOS field, which contains 247 X-ray groups with M200c = 8 × 10¹² − 3 × 10¹⁴ M⊙ at a redshift range 0.08 ≤ z < 1.53. These sources were obtained from the combined data from Chandra and XMM-Newton mosaic image in the 0.5−2 keV band (Gozaliasl et al. 2019). This catalogue has a total cluster flux depth of 3 × 10⁻¹⁶ erg cm−2 s−1, covers an area of 2.1 deg2, and the precision of the centres for extended sources goes down to 5″. None of the positions of our SMGs match any of the X-ray groups reported in the catalogue.
However, since only 11 of 116 SMGs from our sample are at the same redshift as the aforementioned X-ray group catalogue, we then extracted the stacked X-ray flux outside of the already detected groups in the same Chandra and XMM-Newton mosaic image in the 0.5−2 keV band. If the SMG is at the centre of a cluster, it should be located near to the centre of a virialised dark matter halo. The size of this halo at the typical redshift of SMGs is a few hundreds of pkpcs, so we used a 32″ aperture size centred in the SMG, following Finoguenov et al. (2009, 2015). Prior to this we subtracted background and point-like sources such X-ray jets and cluster cores. We detected an average flux of 1.7 ± 0.9 × 10⁻¹⁶ erg s−1 cm−2, which is a marginal detection so we ruled out the possibility of significant X-ray extended emission for our sample. Using the mean redshift of the sample of 2.3, the halo mas (M200) that corresponds to the marginal X-ray flux detection is (2.5 ± 0.7) × 1013 M⊙. We note that this mass is consistent with the typical SMG mass inferred in the clustering studies.
5. Spectroscopic verification of overdensity candidates
As a secondary test, we now evaluate the overdensity parameter δg for those 15 SMGs having spectroscopic redshift found in an overdensity (see Table 1 in Sect. 4) using spectroscopic redshift catalogues, to confirm what we previously found using photometry. For each SMG with a spectroscopic redshift in Table 1, we calculated the overdensity parameter using the sources from the spectroscopic catalogue described in Sect. 2, within a radius of  , and 5′ from the central SMG and in a redshift range of zspec = zSMG ± 3σΔz/(1 + zSMG)(1 + zSMG), being σΔz/(1 + zspec) = 0.0067 for z ≤ 3.5 and σΔz/(1 + zspec) = 0.0155 for z > 3.5, similar to the photometric analysis.
In this case, Σbg is calculated by randomly locating 1000 SMGs in the non-uniform footprint of the COSMOS field covered by the spectroscopic catalogue, as reported in Sect. 2, with a random redshift in the interval 0 < z < 3.5 + 3σΔz/(1 + zSMG)(1 + 3.5) for z ≤ 3.5 within a radius of 5′. For z > 3.5 the redshift is randomly selected within the range 3.5−3σΔz/(1 + zSMG)(1 + 3.5) < z < 6.0. The value of the overdensity parameter δg along with its associated uncertainty is calculated using a truncated Gaussian to the distribution of the number of galaxies generated in the 1000 simulations at z ≤ 3.5. Since the number of recovered sources is small at z > 3.5 (35 964/36 274 sources in the spectroscopic catalogue lie at z ≤ 3.5), above this redshift the function fitted to evaluate the overdensity parameter is instead Poissonian.
Out of the 15 SMGs analysed, we find 7 SMGs in environments that are significantly overdense, meaning δg ≥ 3σ, confirming the photometric identified overdensities for AzTEC/C5, AzTEC/C6a, AzTEC/C6b, AzTEC/C17, AzTEC/C52, AzTEC/C59, and AzTEC/C118. We note that the compilation of the spectroscopic catalogue is strongly redshift dependent, where ∼99% of the observed sources lie at z ≤ 3.5, which diminishes our capability to spectroscopically confirm sources at high redshift. Additionally, since spectroscopic sources are taken from a compilation of different catalogues, the spectral coverage is not completely uniform. These effects limit the conclusions that can be extracted from this analysis and can only be used as a confirmation for those cases showing positive results.
6. Discussion
6.1. Multi-component SMGs
The sample in this paper contains 116 different SMGs, observed in 96 different ALMA fields, meaning 19 out of 96 observations contain more than one SMG. These are the so-called multi-component systems and 39 of the 116 SMGs are one of them. In the following we unravel which SMGs belonging to multi-component systems are gravitationally bounded, and those for which this is simply due to chance alignment.
The SMGs AzTEC/C6a and AzTEC/C6b are separated by Δz = 0.023, a distance slightly higher than the threshold suggested by Hayward et al. (2013), which differentiates between chance and physical associations of ALMA sources. However, both SMGs reside in a high density environment, which points towards a physical association.
Similarly, although each SMG of the triplet in the field AzTEC/C9 lies within 13″ of its closest neighbour, a bit higher than the threshold, all of these are found within an overdensity so they are very likely physically associated. The redshifts for both AzTEC/C28a and AzTEC/C28b are compatible with being identical as is their separation; they are physically associated and are found in an overdensity.
Although redshifts in AzTEC/C43a and AzTEC/C43b are consistent with being identical, we find only one SMG in an overdensity, that is AzTEC/C43b. This could happen if SMG is not located at the centre of the overdensity, so only one of the components would be found using our method. The same occurs for the field AzTEC/C48, while AzTEC/C48a and AzTEC/C48b are physically related, only AzTEC/C48b is found in a dense environment.
Although photometric redshifts for AzTEC/C55a and AzTEC/C55b are compatible with being identical ( and
and 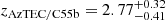 ), considering their physical separation (17.2″, 41 kpc at the measured redshift) it is very unlikely that they are physically associated and only AzTEC/C55b is located in an overdensity. AzTEC/C34a and AzTEC/C34b are not physically related since their redshifts differ strongly (
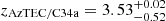 and
and 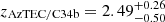 ), their association is only due to chance alignment and we only find AzTEC/C34a in an overdensity. AzTEC/C60a and AzTEC/C60b are not physically associated (
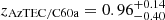 and
and 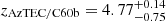 ) and only AzTEC/C60b is found in an overdensity. The same situation is found for the field AzTEC/C100; only AzTEC/C100a is found in a dense environment since AzTEC/C100a and AzTEC/C100b (
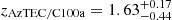 and
and 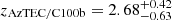 ) results from a chance alignment.
6.2. Comparison with previous results
Early attempts to measure the environment surrounding SMGs involved their projected two-dimensional distribution of the sky using projected two-dimensional angular correlation function (ACF). The results for these early efforts are ambiguous, mostly because of the lack of redshifts to trace the three-dimensional structure (see Scott et al. 2002; Borys et al. 2003, 2004; Almaini et al. 2003; Blain et al. 2004; Weiß et al. 2009; Hickox et al. 2012). Williams et al. (2011) analysed several SMGs in the COSMOS field, assuming various redshift distributions to estimate their de-projected ACF. These authors could only set upper limits to the correlation length. Nonetheless, ACF studies have the important limitation that they are only able to measure the average clustering properties of a population, missing the individual differences between its components.
We do not find a significant redshift difference between those SMGs lying in density peaks and those located in environments that are indistinguishable from field galaxies. The correlation between redshift and clustering in SMGs is yet unclear. For instance, studying the clustering of galaxies selected in the IRAC bands, Farrah et al. (2006) did not find any strong redshift evolution in their sample. Wilkinson et al. (2017) however find that on average, SMGs at z > 2.5 occupy high-mass dark matter haloes.
Aravena et al. (2010) find three SMGs embedded in compact groups (with a typical radial extent of 5″ − 10″) centred at the positions of the SMGs by constructing number density maps of high-redshift BzK galaxies in the COSBO field, the inner 20′ × 20′ region of the COSMOS field (Bertoldi et al. 2007). Two of the sources in their sample, AzTEC/C6a and AzTEC/C7, also appear in ours. We find AzTEC/C6a in a overdensity too, while for AzTEC/C7 the overdensity is not significant in both studies. Additionally, we find a similar percentage of SMGs in overdensities, since they find 30% of their sample in overdensities and we find ∼27% and similar physical sizes, although our sample spans a higher redshift interval. AzTEC/C6 belongs to a proto-cluster, it has been previously found within an X-ray emitting region with 17 spectroscopically confirmed member galaxies (Casey et al. 2015; Wang et al. 2016; Cucciati et al. 2018).
Smolčić et al. (2017) performed an analysis using a similar method over a smaller sample of SMGs in the COSMOS field, and ten of our sources overlap (it is important to note they use a different nomenclature; the list of corresponding names is given in Table A.1 of Brisbin et al. 2017). Nonetheless a direct comparison can be performed only for the “small overdensities” part of their study, where the physical distances analysed are similar to those of this study. Considering only their kpc-scale study, the fraction of SMGs found in a significant overdensity (i.e. ∼27%) is the same as this study. The sources AzTEC/C3a, AzTEC/C14, AzTEC/C22a, and AzTEC/C22b (AzTEC2, AzTEC9, AzTEC11S, and AzTEC11N, respectively in Smolčić et al. 2017) are not found in an overdensity in both studies. However, for AzTEC/C2a and AzTEC/C18 (AzTEC8, AzTEC12, respectively in their nomenclature), neither of us find an overdensity at small scales, but they find high galactic density when looking at Mpc scales. The SMGs AzTEC/C5, AzTEC/C6a, and AzTEC/C17 (AzTEC1, Cosbo 3, and J1000+0234 for these authors) are found in a small-scale overdensity and confirmed spectroscopically by both studies. The only difference we encounter is with the source AzTEC/C42 (AzTEC5), which they find in a significantly dense environment while we do not. This could be because the redshift value they use is 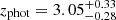 (Smolčić et al. 2012), while a more up-to-date value is available for our study
 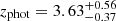 (Smolčić et al. 2017).
7. Summary and conclusions
We explore the clustering properties of a sample of 116 SMGs described as the “strict” sample in Brisbin et al. (2017), drawn from a S/N-limited sample initially discovered with the AzTEC camera on ASTE, and identified with high-resolution 1.25 mm ALMA imaging. Their redshifts lie within the interval 0.829 < z < 5.152 and they are located within the COSMOS field. We evaluate the overdensity parameter δg in an interval Δz and in steps of  , and 5′ from the central SMG, using the latest version of the COSMOS photometric catalogue (COSMOS2015). The accuracy is σΔz/(1 + zspec) = 0.0067 for zphot ≤ 3.5 and σΔz/(1 + zspec) = 0.0155 for zphot > 3.5. Our main results can be summarised as follows:
-
(a)
Thirty-one out of 116 (∼27%) of our sample of AZTEC/ASTE sources selected within the COSMOS survey field are located in high-density environments, suggesting that a fraction of the SMGs are linked to formation of structures.
-
(b)
For those SMGs found lying in overdensities with spectroscopic redshifts (15 out of 31), the photometric approach is tested using spectroscopically verified overdensities, which are able to confirm 7 of these SMGs high-density peaks. However, because of the lack of completeness of the spectroscopic catalogue used for this analysis, this approach can only be used as a lower limit.
-
(c)
We search for extended X-ray emission around SMGs via matching the positions of our SMGs to those of the revised catalogue of extended X-ray sources in the COSMOS field, which contains combined XMM-Newton and Chandra data in the 0.5−2 keV band, with negative results. Moreover, we perform an X-ray stacking analysis in the 0.5−2 keV band using a 32″ aperture size, but the average flux found is 1.7 ± 0.9 × 10⁻¹⁶ erg s−1 cm−2; this contribution is smaller than 1σ so not statistically significant.
This is consistent with previous results that show a similar fraction of SMGs in high-density environments at these angular scales (Aravena et al. 2010; Smolčić et al. 2017). About one-third of our sources are related to the formation of structures at high redshift since they are located in regions with enhanced galaxy density, a fraction that is similar to previous studies (Aravena et al. 2010; Smolčić et al. 2017). We do not appreciate a correlation between redshift and clustering strength.
The reason why we do not find a higher fraction of SMGs associated with strong galaxy overdensities could be due to biases that affect our data. It is a known effect that using photometric redshifts leads to a weaker value of δg (Chiang et al. 2013), therefore our results might be biased towards the most prominent overdensities and we could be missing the not-so-dense environments. To overcome all the caveats present in this work and analyse the environments of SMGs in a robust way, further theoretical and observational efforts are needed, such as a dedicated spectroscopic campaign of the galaxies in the area surrounding the SMGs such as that performed for AzTEC/C6a.
For more information we refer to the COSMOS webpage
Acknowledgments
We thank the anonymous referee for her/his insightful comments that led to improvements in the paper. This research was funded by the European Union’s Seventh Framework programme under grant agreement 337595 (ERC Starting Grant, “CoSMass”). NAC and LB are supported by European Space Agency (ESA) Research Fellowships. We thank B. C. Lemaux and G. Zamorani for helpful discussion and comments that led to improvements in this paper. We gratefully acknowledge the contributions of the entire COSMOS collaboration consisting of more than 100 scientists. More information on the COSMOS survey is available at https://cosmos.astro.caltech.edu/.. We thank the VUDS team for making the data in the COSMOS field available prior to public release.
References
- Almaini, O., Scott, S. E., Dunlop, J. S., et al. 2003, MNRAS, 338, 303 [NASA ADS] [CrossRef] [Google Scholar]
- Almeida, C., Baugh, C. M., & Lacey, C. G. 2011, MNRAS, 417, 2057 [NASA ADS] [CrossRef] [Google Scholar]
- Aravena, M., Bertoldi, F., Carilli, C., et al. 2010, ApJ, 708, L36 [NASA ADS] [CrossRef] [Google Scholar]
- Aretxaga, I., Wilson, G. W., Aguilar, E., et al. 2011, MNRAS, 415, 3831 [Google Scholar]
- Bahcall, N. A. 1996, ArXiv e-prints [arXiv:astro-ph/9611148] [Google Scholar]
- Barger, A. J., Cowie, L. L., Sanders, D. B., et al. 1998, Nature, 394, 248 [NASA ADS] [CrossRef] [Google Scholar]
- Bertoldi, F., Carilli, C., Aravena, M., et al. 2007, ApJS, 172, 132 [Google Scholar]
- Blain, A. W., Smail, I., Ivison, R. J., Kneib, J.-P., & Frayer, D. T. 2002, Phys. Rep., 369, 111 [NASA ADS] [CrossRef] [Google Scholar]
- Blain, A. W., Chapman, S. C., Smail, I., & Ivison, R. 2004, ApJ, 611, 725 [NASA ADS] [CrossRef] [Google Scholar]
- Borys, C., Chapman, S., Halpern, M., & Scott, D. 2003, MNRAS, 344, 385 [NASA ADS] [CrossRef] [Google Scholar]
- Borys, C., Scott, D., Chapman, S., et al. 2004, MNRAS, 355, 485 [NASA ADS] [CrossRef] [Google Scholar]
- Brisbin, D., Miettinen, O., Aravena, M., et al. 2017, A&A, 608, A15 [NASA ADS] [CrossRef] [EDP Sciences] [Google Scholar]
- Capak, P., Aussel, H., Ajiki, M., et al. 2007, ApJS, 172, 99 [NASA ADS] [CrossRef] [Google Scholar]
- Casey, C. M., Narayanan, D., & Cooray, A. 2014, Phys. Rep., 541, 45 [Google Scholar]
- Casey, C. M., Cooray, A., Capak, P., et al. 2015, ApJ, 808, L33 [NASA ADS] [CrossRef] [Google Scholar]
- Chiang, Y.-K., Overzier, R., & Gebhardt, K. 2013, ApJ, 779, 127 [NASA ADS] [CrossRef] [Google Scholar]
- Civano, F., Marchesi, S., Comastri, A., et al. 2016, ApJ, 819, 62 [Google Scholar]
- Comparat, J., Richard, J., Kneib, J.-P., et al. 2015, A&A, 575, A40 [NASA ADS] [CrossRef] [EDP Sciences] [Google Scholar]
- Cucciati, O., Lemaux, B. C., Zamorani, G., et al. 2018, A&A, 619, A49 [NASA ADS] [CrossRef] [EDP Sciences] [Google Scholar]
- Elvis, M., Civano, F., Vignali, C., et al. 2009, ApJS, 184, 158 [NASA ADS] [CrossRef] [Google Scholar]
- Farrah, D., Lonsdale, C. J., Borys, C., et al. 2006, ApJ, 641, L17 [NASA ADS] [CrossRef] [Google Scholar]
- Fasano, G., & Franceschini, A. 1987, MNRAS, 225, 155 [NASA ADS] [CrossRef] [Google Scholar]
- Finoguenov, A., Guzzo, L., Hasinger, G., et al. 2007, ApJS, 172, 182 [NASA ADS] [CrossRef] [Google Scholar]
- Finoguenov, A., Connelly, J. L., Parker, L. C., et al. 2009, ApJ, 704, 564 [NASA ADS] [CrossRef] [Google Scholar]
- Finoguenov, A., Tanaka, M., Cooper, M., et al. 2015, A&A, 576, A130 [NASA ADS] [CrossRef] [EDP Sciences] [Google Scholar]
- Fu, H., Cooray, A., Feruglio, C., et al. 2013, Nature, 498, 338 [NASA ADS] [CrossRef] [Google Scholar]
- Galametz, A., Vernet, J., De Breuck, C., et al. 2010, A&A, 522, A58 [NASA ADS] [CrossRef] [EDP Sciences] [Google Scholar]
- Geach, J. E., Dunlop, J. S., Halpern, M., et al. 2017, MNRAS, 465, 1789 [Google Scholar]
- George, M. R., Leauthaud, A., Bundy, K., et al. 2011, ApJ, 742, 125 [NASA ADS] [CrossRef] [Google Scholar]
- Gozaliasl, G., Finoguenov, A., Tanaka, M., et al. 2019, MNRAS, 483, 3545 [NASA ADS] [CrossRef] [Google Scholar]
- Hasinger, G., Cappelluti, N., Brunner, H., et al. 2007, ApJS, 172, 29 [NASA ADS] [CrossRef] [Google Scholar]
- Hasinger, G., Capak, P., Salvato, M., et al. 2018, ApJ, 858, 77 [Google Scholar]
- Hayward, C. C., Behroozi, P. S., Somerville, R. S., et al. 2013, MNRAS, 434, 2572 [NASA ADS] [CrossRef] [Google Scholar]
- Hickox, R. C., Wardlow, J. L., Smail, I., et al. 2012, MNRAS, 421, 284 [NASA ADS] [Google Scholar]
- Hill, R., Chapman, S., Scott, D., et al. 2020, MNRAS, 495, 3124 [CrossRef] [Google Scholar]
- Holland, W. S., Robson, E. I., Gear, W. K., et al. 1999, MNRAS, 303, 659 [NASA ADS] [CrossRef] [MathSciNet] [Google Scholar]
- Hughes, D. H., Serjeant, S., Dunlop, J., et al. 1998, Nature, 394, 241 [NASA ADS] [CrossRef] [Google Scholar]
- Ilbert, O., McCracken, H. J., Le Fèvre, O., et al. 2013, A&A, 556, A55 [NASA ADS] [CrossRef] [EDP Sciences] [Google Scholar]
- Ivison, R. J., Dunlop, J. S., Smail, I., et al. 2000, ApJ, 542, 27 [NASA ADS] [CrossRef] [Google Scholar]
- Kartaltepe, J. S., Sanders, D. B., Le Floc’h, E., et al. 2010, ApJ, 721, 98 [NASA ADS] [CrossRef] [Google Scholar]
- Kriek, M., Shapley, A. E., Reddy, N. A., et al. 2015, ApJS, 218, 15 [NASA ADS] [CrossRef] [Google Scholar]
- Krogager, J.-K., Zirm, A. W., Toft, S., Man, A., & Brammer, G. 2014, ApJ, 797, 17 [NASA ADS] [CrossRef] [Google Scholar]
- Laigle, C., McCracken, H. J., Ilbert, O., et al. 2016, ApJS, 224, 24 [NASA ADS] [CrossRef] [Google Scholar]
- Larson, D., Dunkley, J., Hinshaw, G., et al. 2011, ApJS, 192, 16 [NASA ADS] [CrossRef] [Google Scholar]
- Le Fèvre, O., Tasca, L. A. M., Cassata, P., et al. 2015, A&A, 576, A79 [NASA ADS] [CrossRef] [EDP Sciences] [Google Scholar]
- Lilly, S. J., Eales, S. A., Gear, W. K. P., et al. 1999, ApJ, 518, 641 [NASA ADS] [CrossRef] [Google Scholar]
- Lilly, S. J., Le Fèvre, O., Renzini, A., et al. 2007, ApJS, 172, 70 [NASA ADS] [CrossRef] [Google Scholar]
- Lilly, S. J., Le Brun, V., Maier, C., et al. 2009, ApJS, 184, 218 [Google Scholar]
- McCracken, H. J., Milvang-Jensen, B., Dunlop, J., et al. 2012, A&A, 544, A156 [NASA ADS] [CrossRef] [EDP Sciences] [Google Scholar]
- Oke, J. B. 1974, ApJS, 27, 21 [NASA ADS] [CrossRef] [Google Scholar]
- Onodera, M., Renzini, A., Carollo, M., et al. 2012, ApJ, 755, 26 [NASA ADS] [CrossRef] [Google Scholar]
- Oteo, I., Ivison, R. J., Dunne, L., et al. 2018, ApJ, 856, 72 [Google Scholar]
- Ouchi, M., Shimasaku, K., Akiyama, M., et al. 2005, ApJ, 620, L1 [NASA ADS] [CrossRef] [Google Scholar]
- Overzier, R. A., Guo, Q., Kauffmann, G., et al. 2009, MNRAS, 394, 577 [NASA ADS] [CrossRef] [Google Scholar]
- Peacock, J. A. 1983, MNRAS, 202, 615 [NASA ADS] [Google Scholar]
- Roseboom, I. G., Bunker, A., Sumiyoshi, M., et al. 2012, MNRAS, 426, 1782 [NASA ADS] [CrossRef] [Google Scholar]
- Rowan-Robinson, M., Wang, L., Farrah, D., et al. 2018, A&A, 619, A169 [NASA ADS] [CrossRef] [EDP Sciences] [Google Scholar]
- Sanders, D. B., Salvato, M., Aussel, H., et al. 2007, ApJS, 172, 86 [Google Scholar]
- Scott, S. E., Fox, M. J., Dunlop, J. S., et al. 2002, MNRAS, 331, 817 [NASA ADS] [CrossRef] [Google Scholar]
- Scoville, N., Aussel, H., Brusa, M., et al. 2007, ApJS, 172, 1 [NASA ADS] [CrossRef] [Google Scholar]
- Silverman, J. D., Kashino, D., Sanders, D., et al. 2015, ApJS, 220, 12 [NASA ADS] [CrossRef] [Google Scholar]
- Smolčić, V., Aravena, M., Navarrete, F., et al. 2012, A&A, 548, A4 [NASA ADS] [CrossRef] [EDP Sciences] [Google Scholar]
- Smolčić, V., Miettinen, O., Tomičić, N., et al. 2017, A&A, 597, A4 [NASA ADS] [CrossRef] [EDP Sciences] [Google Scholar]
- Spergel, D. N., Bean, R., Doré, O., et al. 2007, ApJS, 170, 377 [NASA ADS] [CrossRef] [Google Scholar]
- Springel, V., White, S. D. M., Jenkins, A., et al. 2005, Nature, 435, 629 [NASA ADS] [CrossRef] [PubMed] [Google Scholar]
- Stach, S. M., Dudzevičiūtė, U., Smail, I., et al. 2019, MNRAS, 487, 4648 [NASA ADS] [CrossRef] [Google Scholar]
- Strandet, M. L., Weiss, A., Vieira, J. D., et al. 2016, ApJ, 822, 80 [NASA ADS] [CrossRef] [Google Scholar]
- Tasca, L. A. M., Le Fèvre, O., Ribeiro, B., et al. 2017, A&A, 600, A110 [NASA ADS] [CrossRef] [EDP Sciences] [Google Scholar]
- Toft, S., Smolčić, V., Magnelli, B., et al. 2014, ApJ, 782, 68 [NASA ADS] [CrossRef] [Google Scholar]
- Toshikawa, J., Kashikawa, N., Ota, K., et al. 2012, ApJ, 750, 137 [NASA ADS] [CrossRef] [Google Scholar]
- Wang, T., Elbaz, D., Daddi, E., et al. 2016, ApJ, 828, 56 [NASA ADS] [CrossRef] [Google Scholar]
- Weiß, A., Kovács, A., Coppin, K., et al. 2009, ApJ, 707, 1201 [NASA ADS] [CrossRef] [Google Scholar]
- Wilkinson, A., Almaini, O., Chen, C.-C., et al. 2017, MNRAS, 464, 1380 [NASA ADS] [CrossRef] [Google Scholar]
- Williams, C. C., Giavalisco, M., Porciani, C., et al. 2011, ApJ, 733, 92 [NASA ADS] [CrossRef] [Google Scholar]
- Xia, J.-Q., Negrello, M., Lapi, A., et al. 2012, MNRAS, 422, 1324 [NASA ADS] [CrossRef] [Google Scholar]
- Zabl, J., Nørgaard-Nielsen, H. U., Fynbo, J. P. U., et al. 2015, MNRAS, 451, 2050 [NASA ADS] [CrossRef] [Google Scholar]
Appendix A: Additional figure
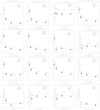 |
Fig. A.1. Overdensity parameter δg vs. radius r measured from the central SMG. Open dots represent when the only source measured within that radius is the target SMG, and black dots represent when at least one more source than the central SMG is observed. Error bars represent Poissonian errors. The dot is enclosed in a square when Poisson probability is p ≤ 0.05. The name of each SMG is indicated in the legend and the number of sources found within a radius r is indicated next to each point. A horizontal line represents δg = 0. |
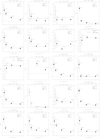 |
Fig. A.1. continued. |
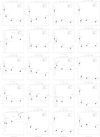 |
Fig. A.1. continued. |
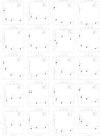 |
Fig. A.1. continued. |
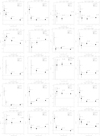 |
Fig. A.1. continued. |
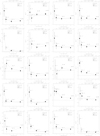 |
Fig. A.1. continued. |
All Tables
All Figures
|
Fig. 1. Redshift distribution of the SMGs found in a significant overdensity (in grey, dashed) and those that are not found in a high-density environment (in orange, solid). There is no significant difference between their redshift distribution at a 95% confidence level according to the K-S test. |
| In the text | |
|
Fig. A.1. Overdensity parameter δg vs. radius r measured from the central SMG. Open dots represent when the only source measured within that radius is the target SMG, and black dots represent when at least one more source than the central SMG is observed. Error bars represent Poissonian errors. The dot is enclosed in a square when Poisson probability is p ≤ 0.05. The name of each SMG is indicated in the legend and the number of sources found within a radius r is indicated next to each point. A horizontal line represents δg = 0. |
| In the text | |
|
Fig. A.1. continued. |
| In the text | |
|
Fig. A.1. continued. |
| In the text | |
|
Fig. A.1. continued. |
| In the text | |
|
Fig. A.1. continued. |
| In the text | |
|
Fig. A.1. continued. |
| In the text | |
Current usage metrics show cumulative count of Article Views (full-text article views including HTML views, PDF and ePub downloads, according to the available data) and Abstracts Views on Vision4Press platform.
Data correspond to usage on the plateform after 2015. The current usage metrics is available 48-96 hours after online publication and is updated daily on week days.
Initial download of the metrics may take a while.