Fig. A.1.
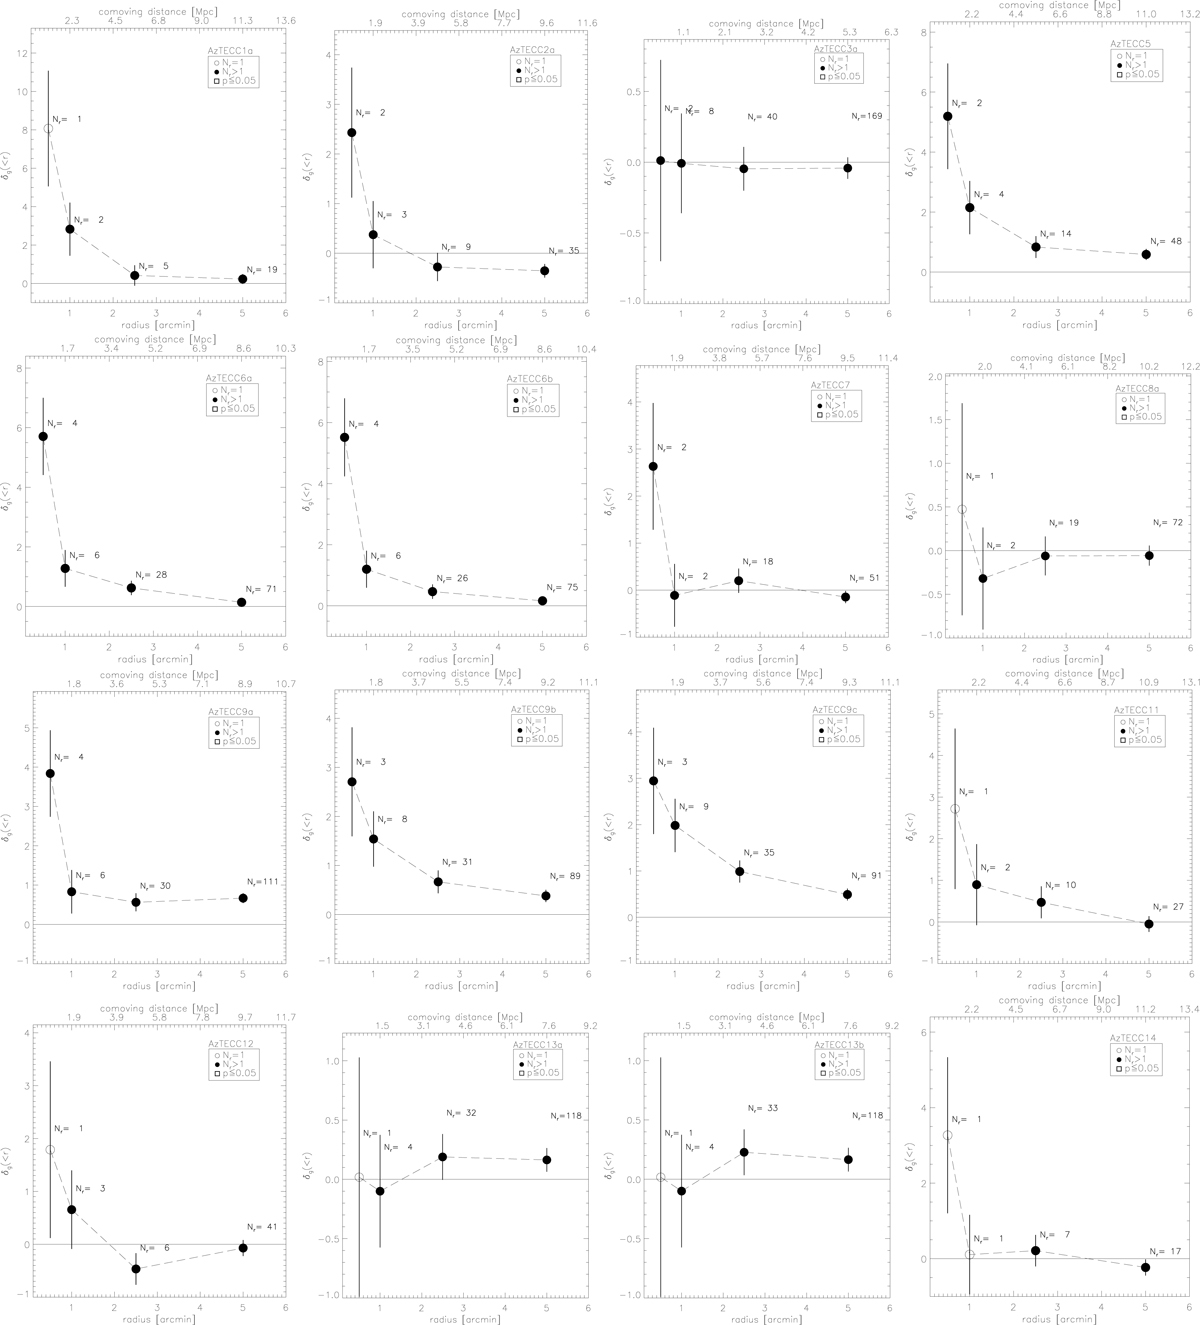
Overdensity parameter δg vs. radius r measured from the central SMG. Open dots represent when the only source measured within that radius is the target SMG, and black dots represent when at least one more source than the central SMG is observed. Error bars represent Poissonian errors. The dot is enclosed in a square when Poisson probability is p ≤ 0.05. The name of each SMG is indicated in the legend and the number of sources found within a radius r is indicated next to each point. A horizontal line represents δg = 0.
Current usage metrics show cumulative count of Article Views (full-text article views including HTML views, PDF and ePub downloads, according to the available data) and Abstracts Views on Vision4Press platform.
Data correspond to usage on the plateform after 2015. The current usage metrics is available 48-96 hours after online publication and is updated daily on week days.
Initial download of the metrics may take a while.