Fig. 6
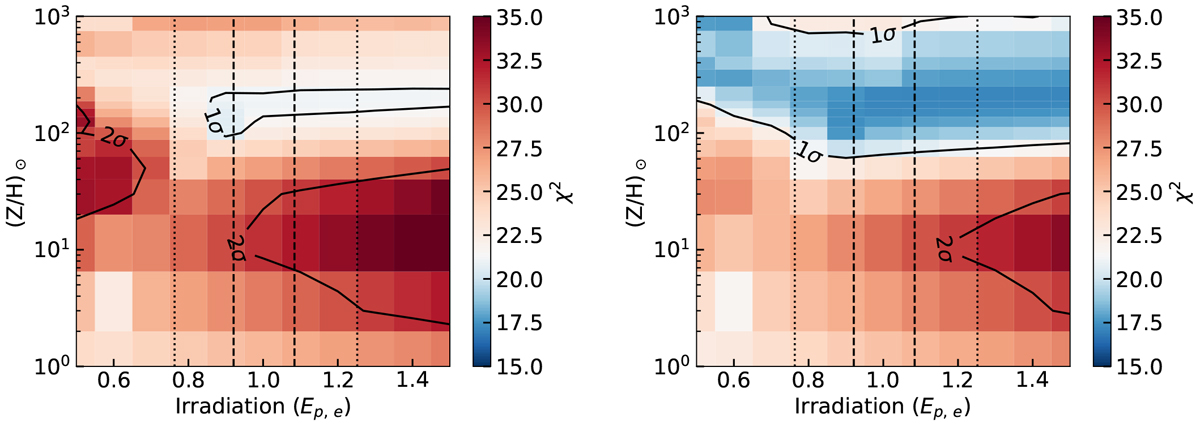
Goodness of fit of our nominal models, varying only irradiation and metallicity. Left: data from Benneke et al. (2019), including HST, K2, and Spitzer data. Right: data from Tsiaras et al. (2019), including HST, K2, and Spitzer data. The white colour corresponds to the value of χ2 of 21.36, indicating a fit of the datasets at the 1σ confidence level. Accordingly, the blue colour indicates overfit and the red colour underfit of the datasets. The solid lines represents the 1 and 2σ confidencelevels of our fits. The dashed and dotted lines represents, respectively, the 1 and 3σ uncertainties on K2-18b irradiation.
Current usage metrics show cumulative count of Article Views (full-text article views including HTML views, PDF and ePub downloads, according to the available data) and Abstracts Views on Vision4Press platform.
Data correspond to usage on the plateform after 2015. The current usage metrics is available 48-96 hours after online publication and is updated daily on week days.
Initial download of the metrics may take a while.