Fig. 5
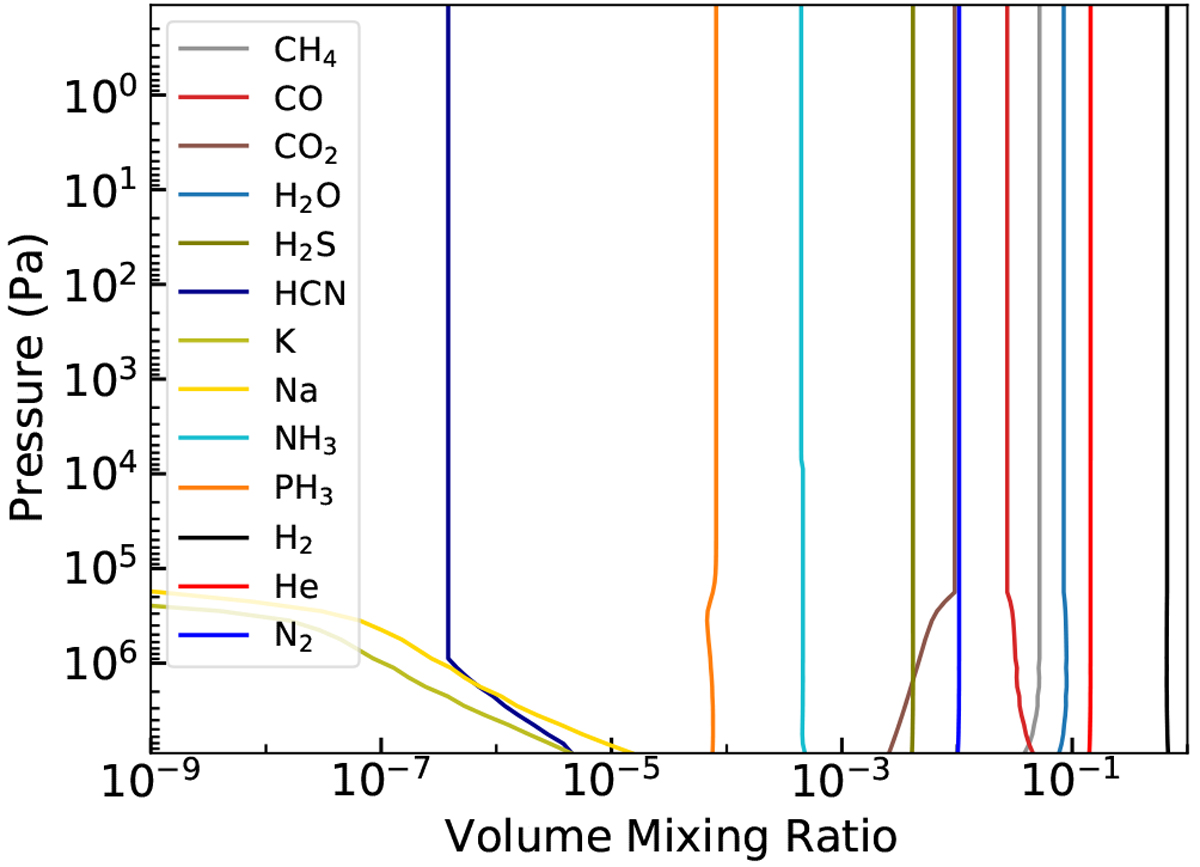
VMR of our best fit atmospheric model against the dataset from Benneke et al. (2019) at nominal irradiation (175 (Z/H)⊙, Kzz = 106 cm2 s−1). For clarity, only absorbing species and N2 are represented. FeH, TiO, and VO are not represented as their respective abundances are, respectively, < 10−12, < 10−35, and < 10−36 within our pressure grid. The bump of the PH3 VMR at 200 kPa is due to the chemical equilibrium between PH3 and P2 peaking in favour of P2 at this pressure.
Current usage metrics show cumulative count of Article Views (full-text article views including HTML views, PDF and ePub downloads, according to the available data) and Abstracts Views on Vision4Press platform.
Data correspond to usage on the plateform after 2015. The current usage metrics is available 48-96 hours after online publication and is updated daily on week days.
Initial download of the metrics may take a while.