Fig. 17
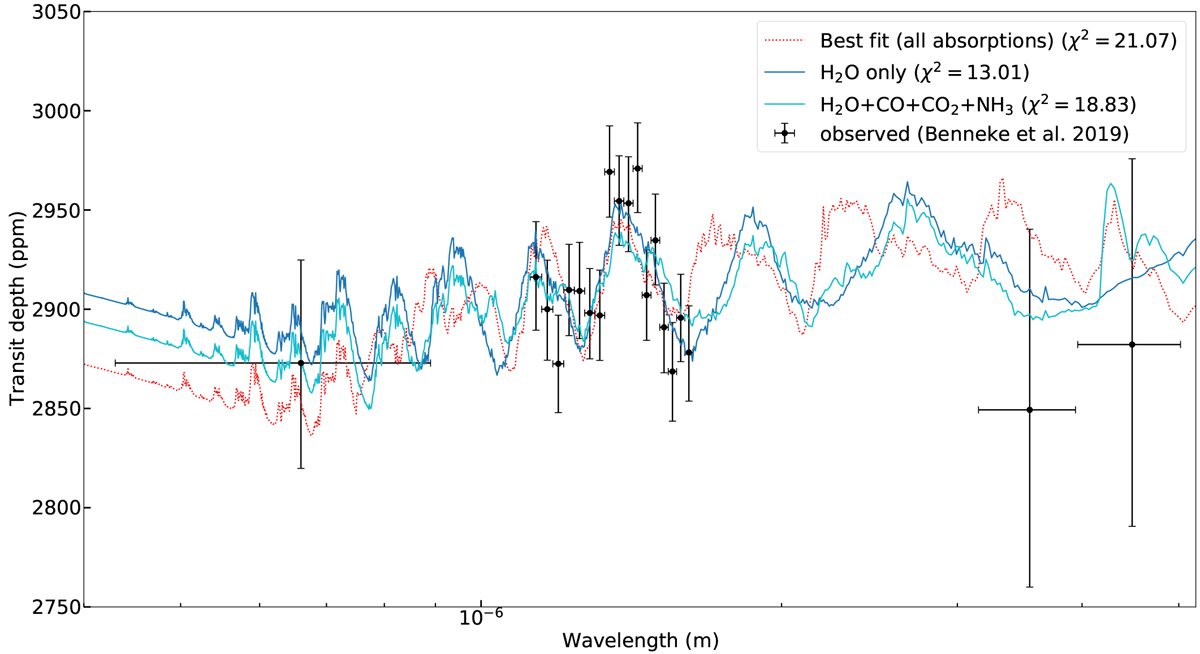
Best fit against Benneke et al. (2019) dataset with transit spectra in which the spectral contributions of selected species has been removed. Blue: H2 O contribution of the transit spectrum displayed in Fig. 3, with an offset of the 105 -Pa level of +98 km. Cyan: H2O, CO, CO2, and NH3 total contribution of the transit spectrum displayed in Fig. 3, with an offset of the 105 -Pa level of + 57 km. Black: K2, HST and Spitzer from Benneke et al. (2019). The dotted red line is our best-fit spectrum with all absorptions (see Sect. 4). The χ2 of these spectra against the data is indicated in parentheses.
Current usage metrics show cumulative count of Article Views (full-text article views including HTML views, PDF and ePub downloads, according to the available data) and Abstracts Views on Vision4Press platform.
Data correspond to usage on the plateform after 2015. The current usage metrics is available 48-96 hours after online publication and is updated daily on week days.
Initial download of the metrics may take a while.