Open Access
Fig. 13
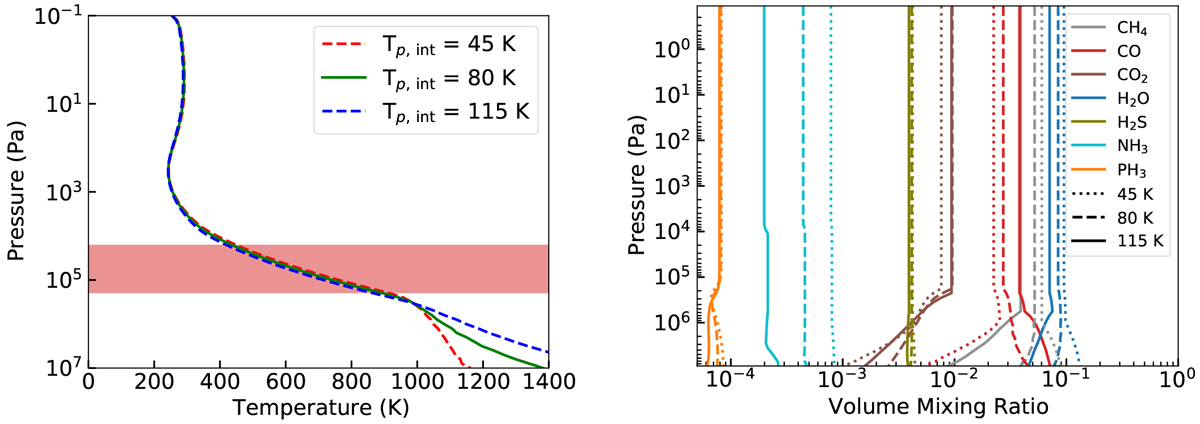
Effects of Tp, int on K2-18b, at 175 (Z/H)⊙, nominal irradiation, and Kzz = 106 cm2 s−1. Left: temperature profiles. The red area represents the convective layers. Right: VMR of the most abundant absorbers. Dotted: Tp, int = 45 K. Dashed: Tp, int = 80 K. Solid: Tp, int = 115 K.
Current usage metrics show cumulative count of Article Views (full-text article views including HTML views, PDF and ePub downloads, according to the available data) and Abstracts Views on Vision4Press platform.
Data correspond to usage on the plateform after 2015. The current usage metrics is available 48-96 hours after online publication and is updated daily on week days.
Initial download of the metrics may take a while.