Fig. 3.
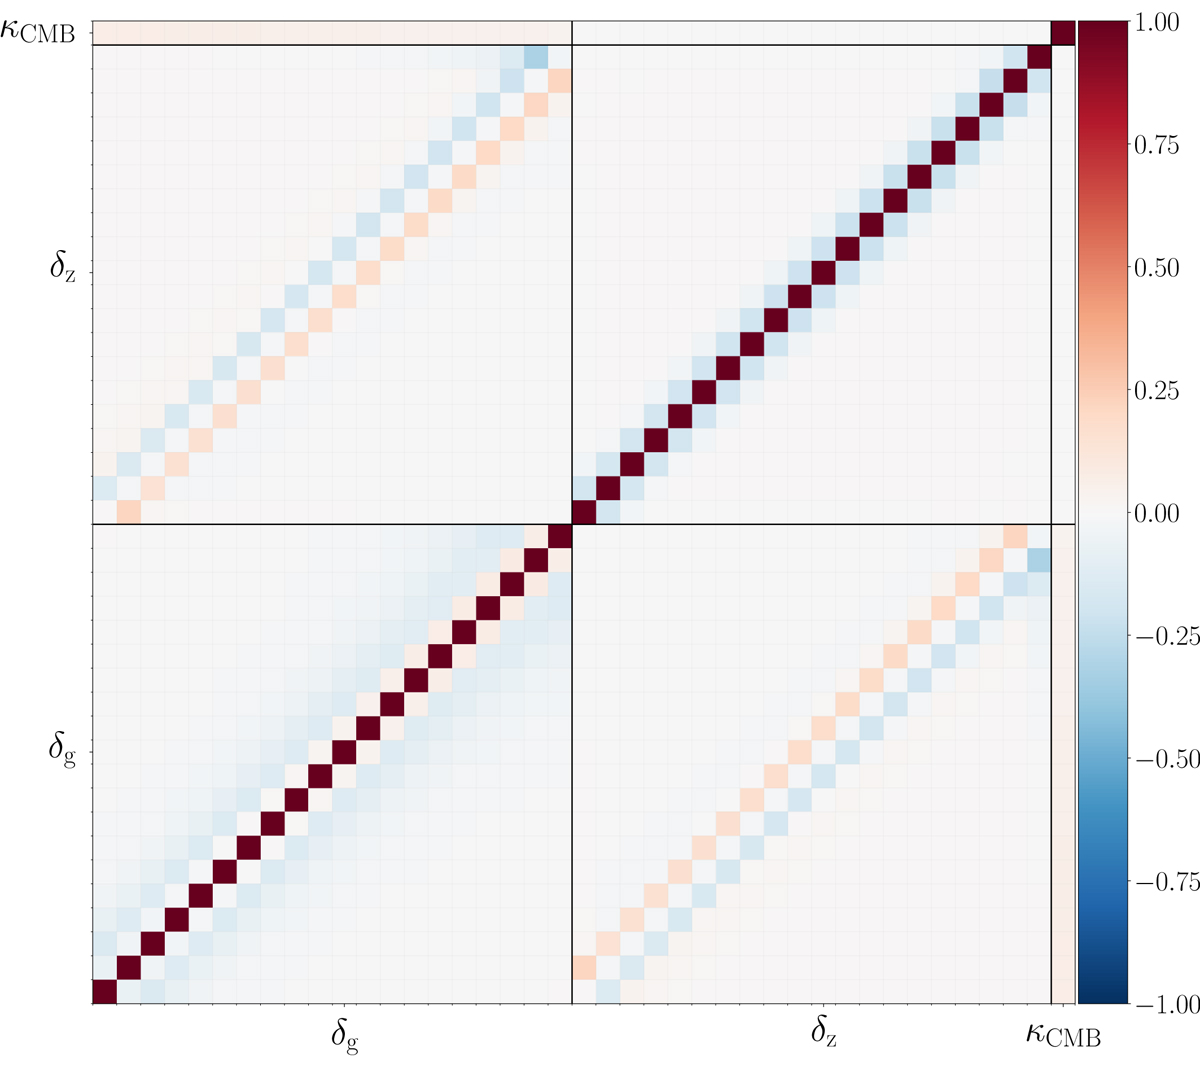
Correlation matrix between our observables for the 20 redshift bins in an Euclid-like survey, at ℓ = 10. This matrix corresponds to the Dg, z, κCMB(ℓ = 10) data vector. The value in each pixel corresponds to ![]() . All the data vectors considered in Eqs. (19)–(20) are a subset of this matrix. We see that there is no correlation between δg and δz inside the same redshift bin (diagonals of the upper-left and lower-right blocks), and that there are opposite and positive correlations for neighbouring bins.
. All the data vectors considered in Eqs. (19)–(20) are a subset of this matrix. We see that there is no correlation between δg and δz inside the same redshift bin (diagonals of the upper-left and lower-right blocks), and that there are opposite and positive correlations for neighbouring bins.
Current usage metrics show cumulative count of Article Views (full-text article views including HTML views, PDF and ePub downloads, according to the available data) and Abstracts Views on Vision4Press platform.
Data correspond to usage on the plateform after 2015. The current usage metrics is available 48-96 hours after online publication and is updated daily on week days.
Initial download of the metrics may take a while.