Fig. 2.
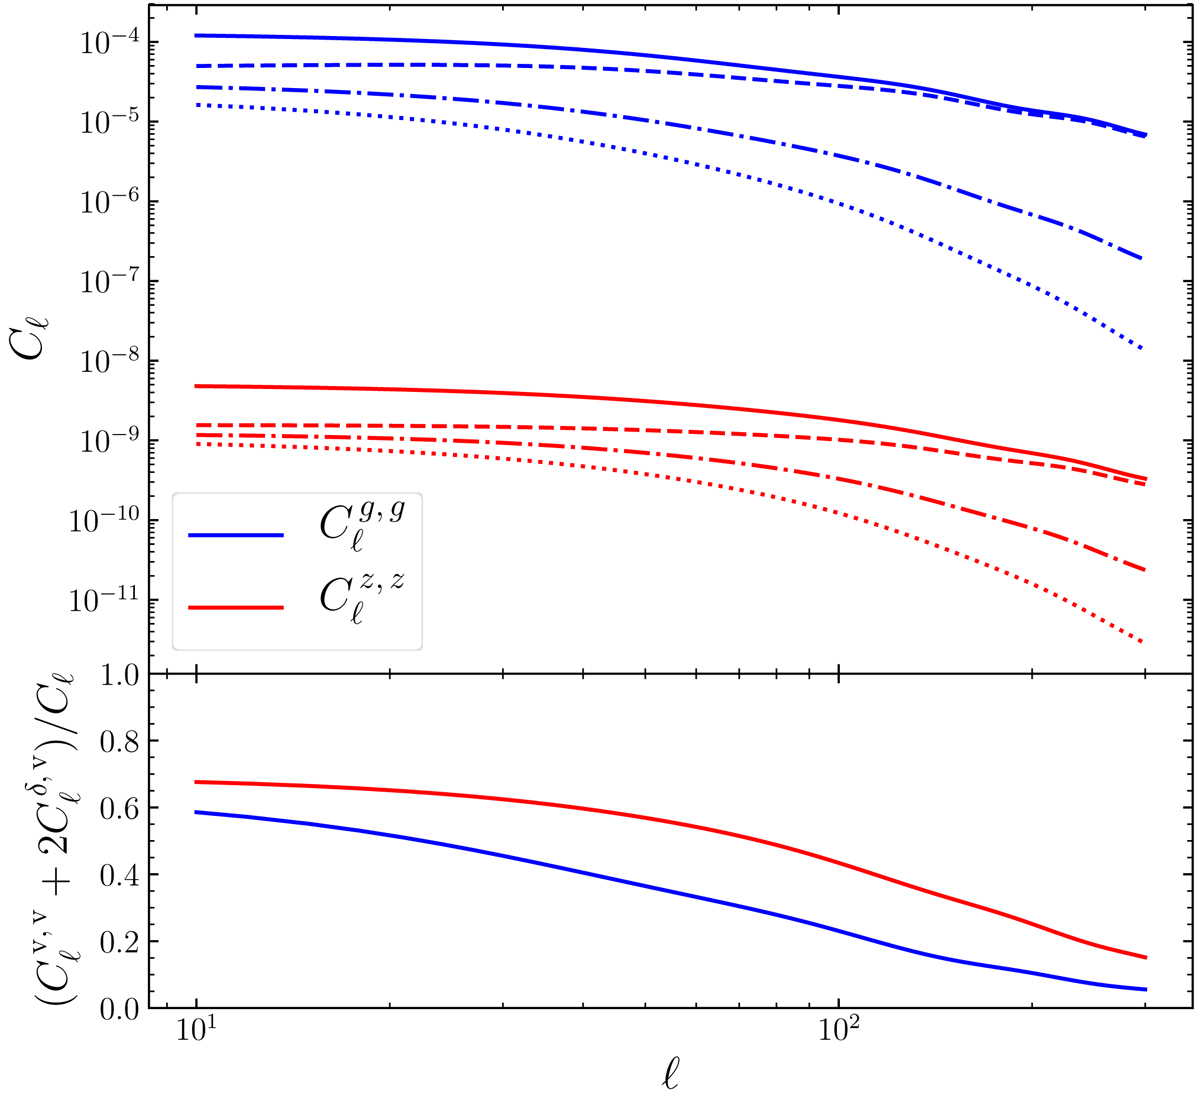
Top panel: power spectra of angular galaxy clustering (δg, in blue) and ARF (δz, in red), for a Gaussian redshift bin taken in a DESI-like survey. The bin is centred on zi = 0.75 and has a standard deviation of σz = 0.01. The dashed line shows the term coming from the density kernel ![]() , the dotted line shows the part coming from the velocity kernel
, the dotted line shows the part coming from the velocity kernel ![]() , and the dot-dashed line shows the cross term
, and the dot-dashed line shows the cross term ![]() . The total Cℓ power spectra (plain lines) correspond to the sum
. The total Cℓ power spectra (plain lines) correspond to the sum ![]() . Bottom panel: velocity dependence ratio in the power spectrum (
. Bottom panel: velocity dependence ratio in the power spectrum (![]() ) over the complete power spectrum, for the angular galaxy clustering (blue line) and for the ARF (red line). This figure shows that ARF are more sensitive to the peculiar velocity of galaxies than angular galaxy clustering, for the same redshift shell.
) over the complete power spectrum, for the angular galaxy clustering (blue line) and for the ARF (red line). This figure shows that ARF are more sensitive to the peculiar velocity of galaxies than angular galaxy clustering, for the same redshift shell.
Current usage metrics show cumulative count of Article Views (full-text article views including HTML views, PDF and ePub downloads, according to the available data) and Abstracts Views on Vision4Press platform.
Data correspond to usage on the plateform after 2015. The current usage metrics is available 48-96 hours after online publication and is updated daily on week days.
Initial download of the metrics may take a while.