Fig. 1.
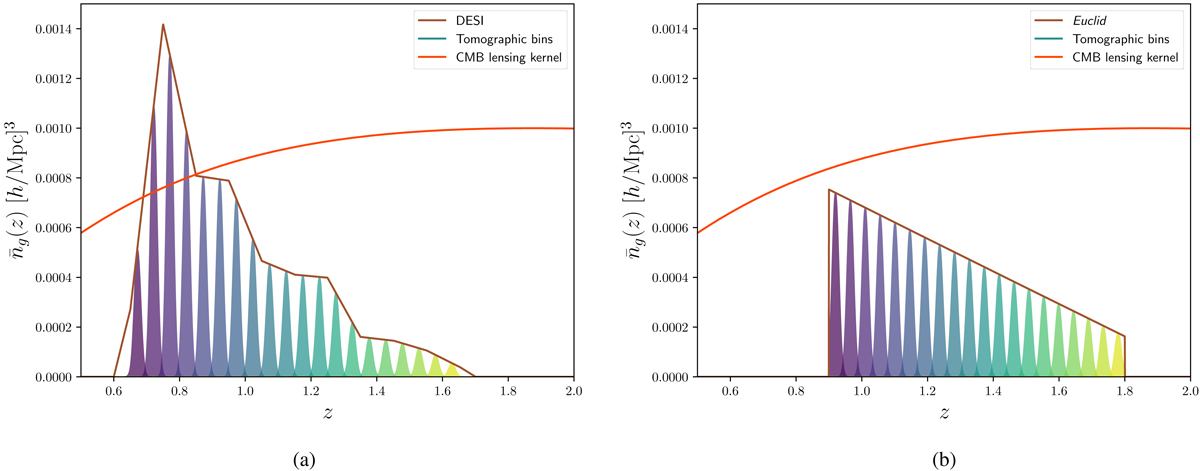
Galaxy density distribution as a function of redshift for the emission line galaxies (ELG) of DESI (left panel), and the Euclid spectroscopic sample (right panel). The filled coloured lines show the Gaussian bins used in our analysis, colour-coded as a function of the bin index. The orange line shows the CMB lensing efficiency kernel (with arbitrary normalisation).
Current usage metrics show cumulative count of Article Views (full-text article views including HTML views, PDF and ePub downloads, according to the available data) and Abstracts Views on Vision4Press platform.
Data correspond to usage on the plateform after 2015. The current usage metrics is available 48-96 hours after online publication and is updated daily on week days.
Initial download of the metrics may take a while.