Table 3.
HI profiles and PanSTARRS multi-band images of the 628 galaxies observed at GBT.
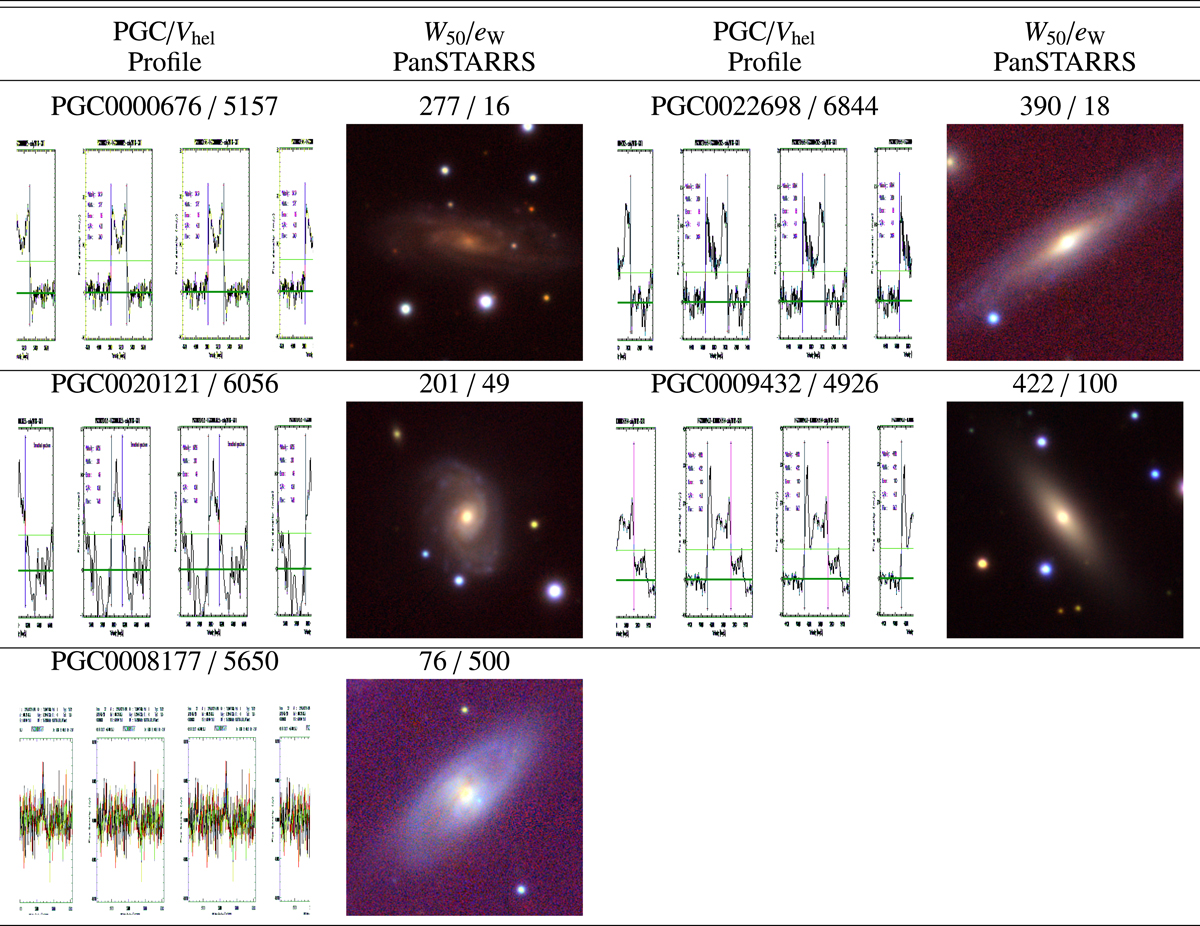
Notes. Columns 1 and 3 give the PGC number, the heliocentric velocity Vhel in km s−1, and the HI profile after the measurement of the line width. In the case of non-detection, the raw spectra obtained from the GBT is shown in red. Columns 2 and 4 give the raw line width W50 and its error eW in km s−1, as well as the PanSTARRS image composite of the bands y/i/g. The full table is available at the CDS.
Current usage metrics show cumulative count of Article Views (full-text article views including HTML views, PDF and ePub downloads, according to the available data) and Abstracts Views on Vision4Press platform.
Data correspond to usage on the plateform after 2015. The current usage metrics is available 48-96 hours after online publication and is updated daily on week days.
Initial download of the metrics may take a while.