Open Access
Fig. 7.
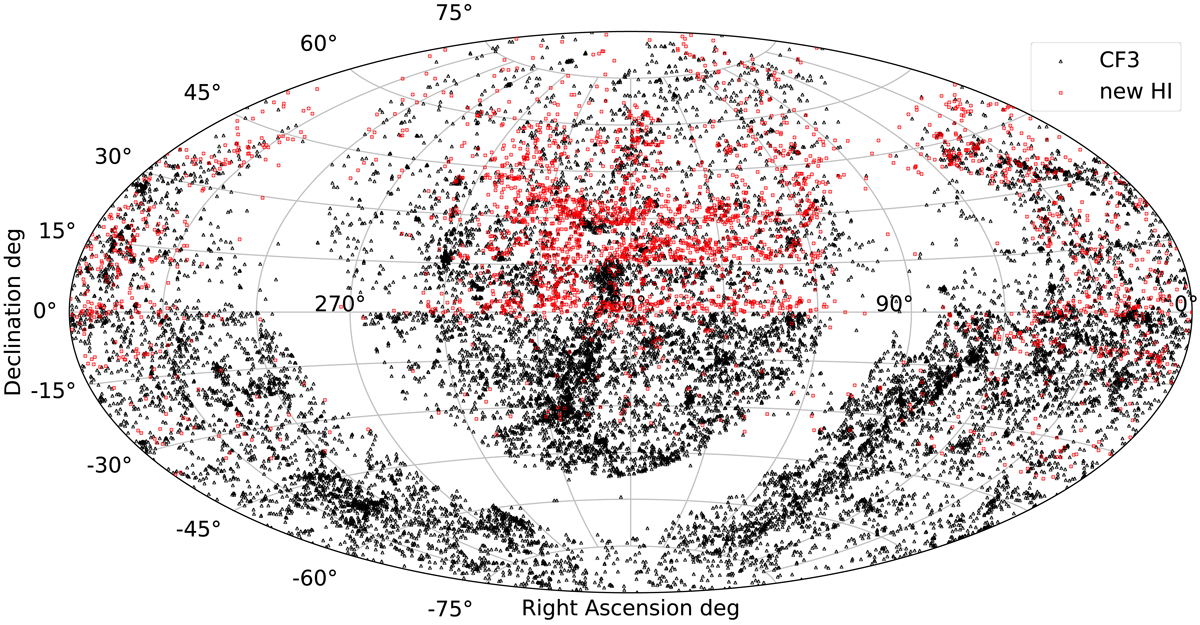
Sky distribution in equatorial coordinates of all new line width measurements presented in this paper, which are adequate for TF distance measurement. The black triangles correspond to the Cosmicflows-3 catalog, while the red dots represent the new additional HI data.
Current usage metrics show cumulative count of Article Views (full-text article views including HTML views, PDF and ePub downloads, according to the available data) and Abstracts Views on Vision4Press platform.
Data correspond to usage on the plateform after 2015. The current usage metrics is available 48-96 hours after online publication and is updated daily on week days.
Initial download of the metrics may take a while.