Fig. 2.
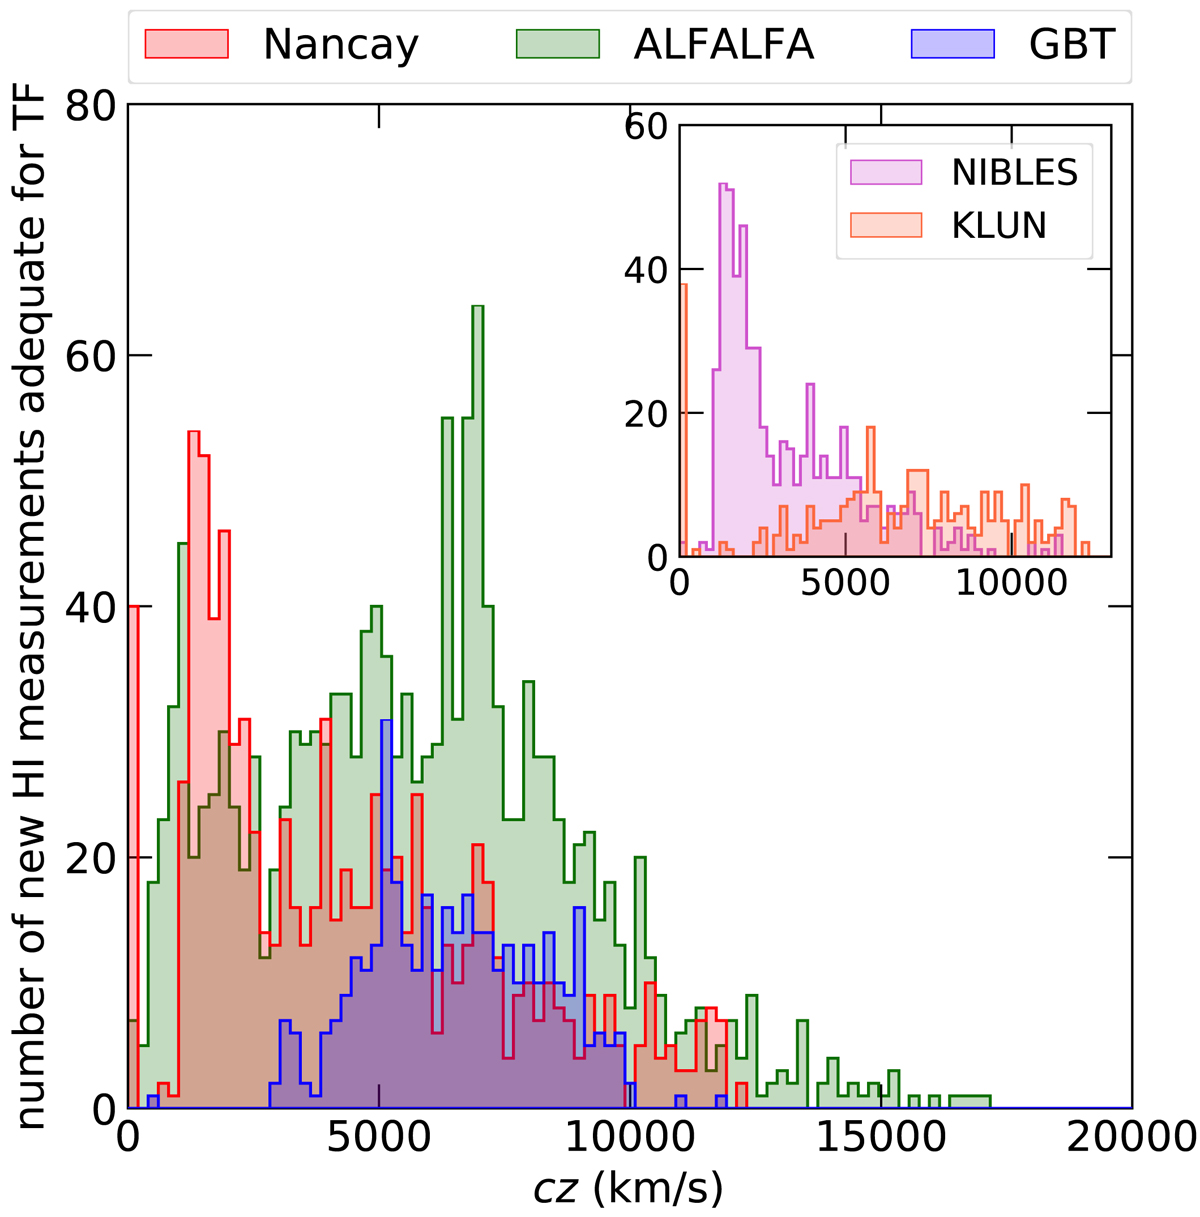
Redshift distribution of new HI data described in this paper. The Nançay, Arecibo, and GBT data are shown in red, green, and blue, respectively. Only new additions to the ADHI catalog that are adequate for the use of the TF relation are considered. The subset plot in the top right corner shows the redshift distribution of Nançay data only. The NIBLESI and KLUN17 data are in purple and orange, respectively.
Current usage metrics show cumulative count of Article Views (full-text article views including HTML views, PDF and ePub downloads, according to the available data) and Abstracts Views on Vision4Press platform.
Data correspond to usage on the plateform after 2015. The current usage metrics is available 48-96 hours after online publication and is updated daily on week days.
Initial download of the metrics may take a while.