Fig. 4
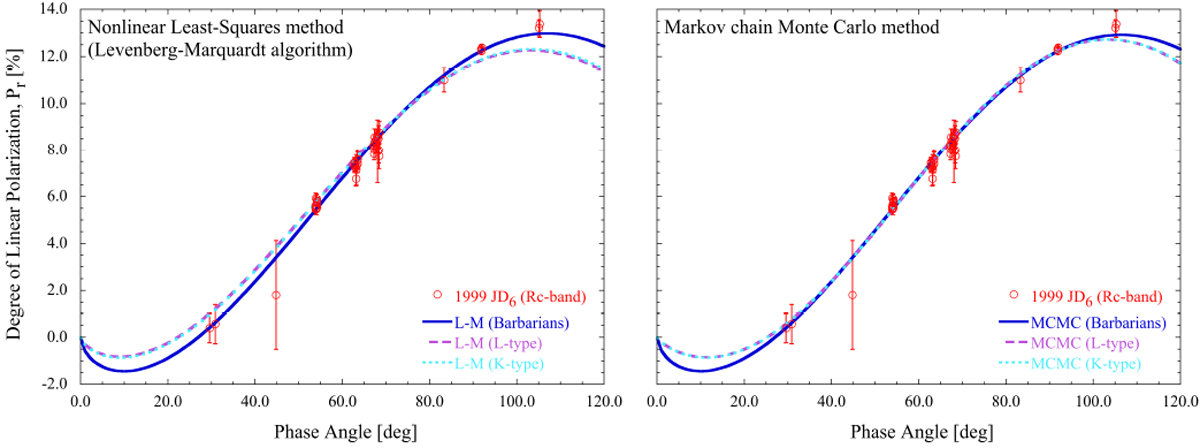
Comparison of phase-polarization curves under two fitting methods. The left and right panels demonstrate curve fitting using the nonlinear least-squares method (the Levenberg-Marquardt algorithm) and the Markov chain Monte Carlo method, respectively, using Eq. (7). The open red circles indicate the RC band data of 1999 JD6 in this work. The solid blue, dashed purple, and dotted cyan lines correspond to the Barbarians, L-type, and K-type asteroids, that is, the values of Pmin we used for the fit. Both methods yielded similar convergent solutions in the Babarian model.
Current usage metrics show cumulative count of Article Views (full-text article views including HTML views, PDF and ePub downloads, according to the available data) and Abstracts Views on Vision4Press platform.
Data correspond to usage on the plateform after 2015. The current usage metrics is available 48-96 hours after online publication and is updated daily on week days.
Initial download of the metrics may take a while.