Fig. 3
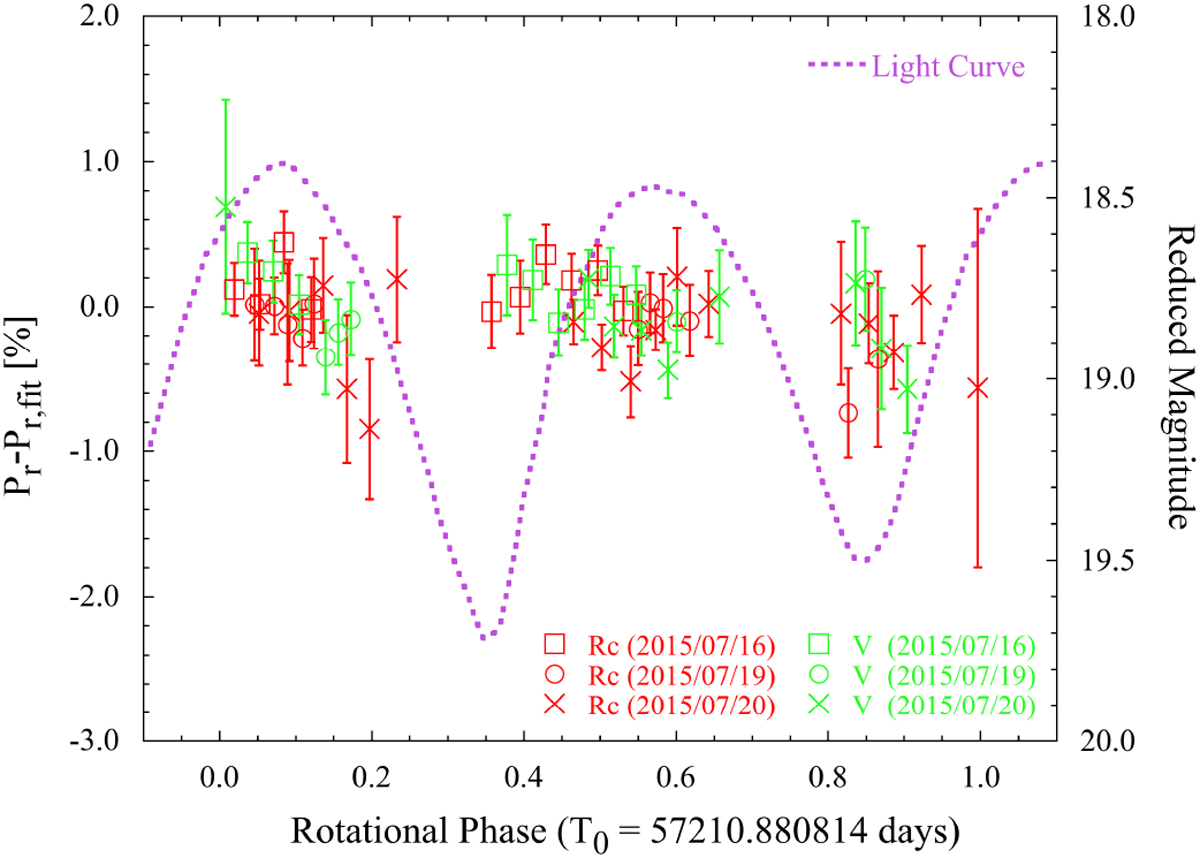
Relation between rotational phase and polarization degree of 1999 JD6. The open squares, open circles, and crosses indicate individual data obtained on July 16, 19, and 20, 2016, respectively (see Table B.1). The plotted data are the deviations after subtracting the increasing portion of the polarization degree from the phase angle. Both bands (V band in green and RC band in red) show small but similar fluctuations in the rotation phase (light curve from Vaduvescu et al. 2017). Our data provide insufficient coverage of the rotational phase to confirm its repeatability.
Current usage metrics show cumulative count of Article Views (full-text article views including HTML views, PDF and ePub downloads, according to the available data) and Abstracts Views on Vision4Press platform.
Data correspond to usage on the plateform after 2015. The current usage metrics is available 48-96 hours after online publication and is updated daily on week days.
Initial download of the metrics may take a while.