Fig. 4.
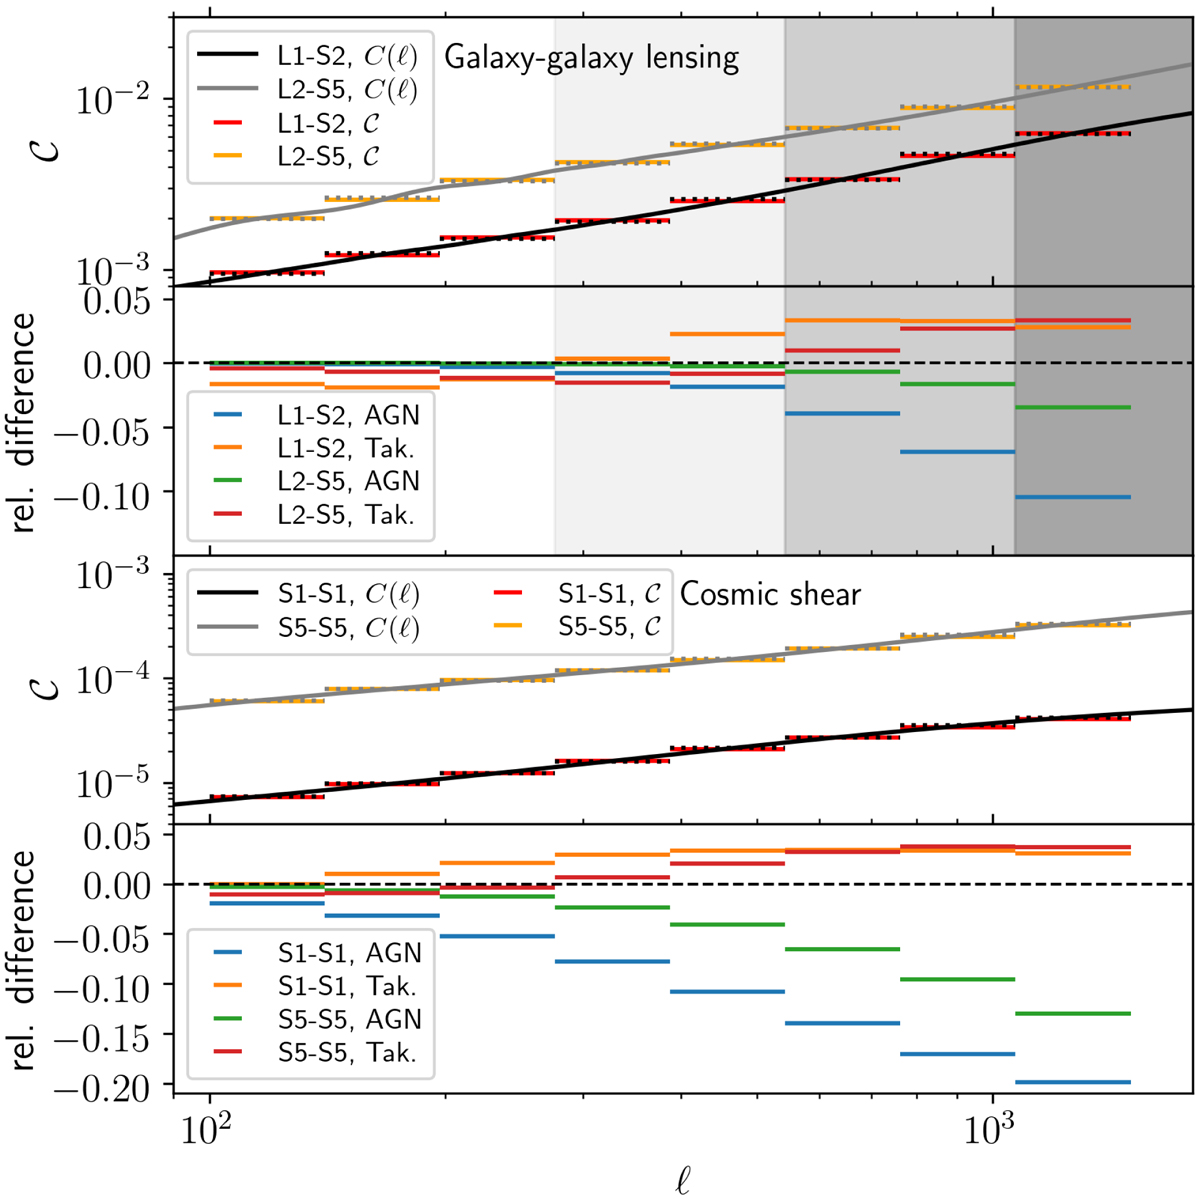
Bandpowers for galaxy-galaxy lensing (top panels) and cosmic shear (bottom panels) for a selection of redshift bin combinations (indicated by ‘L’ and ‘S’ for lens and source galaxy samples, respectively; see Sect. 3 for details). Grey and black lines show the true underlying angular power spectrum; the associated dotted lines the average of these power spectra over the angular frequency band. Bottom panels: relative deviations in the cases of maximum AGN feedback (blue/green) and using the Takahashi et al. (2012) Halofit version (orange/red) with respect to Mead et al. (2015) without AGN feedback. The grey shaded regions in the top panels show the conservative limits applied to the low- and high-redshift lens samples (excluding all and light/medium grey regions, respectively), as well as the more optimistic cut if galaxy biasing were well understood (only excluding the dark grey region).
Current usage metrics show cumulative count of Article Views (full-text article views including HTML views, PDF and ePub downloads, according to the available data) and Abstracts Views on Vision4Press platform.
Data correspond to usage on the plateform after 2015. The current usage metrics is available 48-96 hours after online publication and is updated daily on week days.
Initial download of the metrics may take a while.