Fig. D.9.
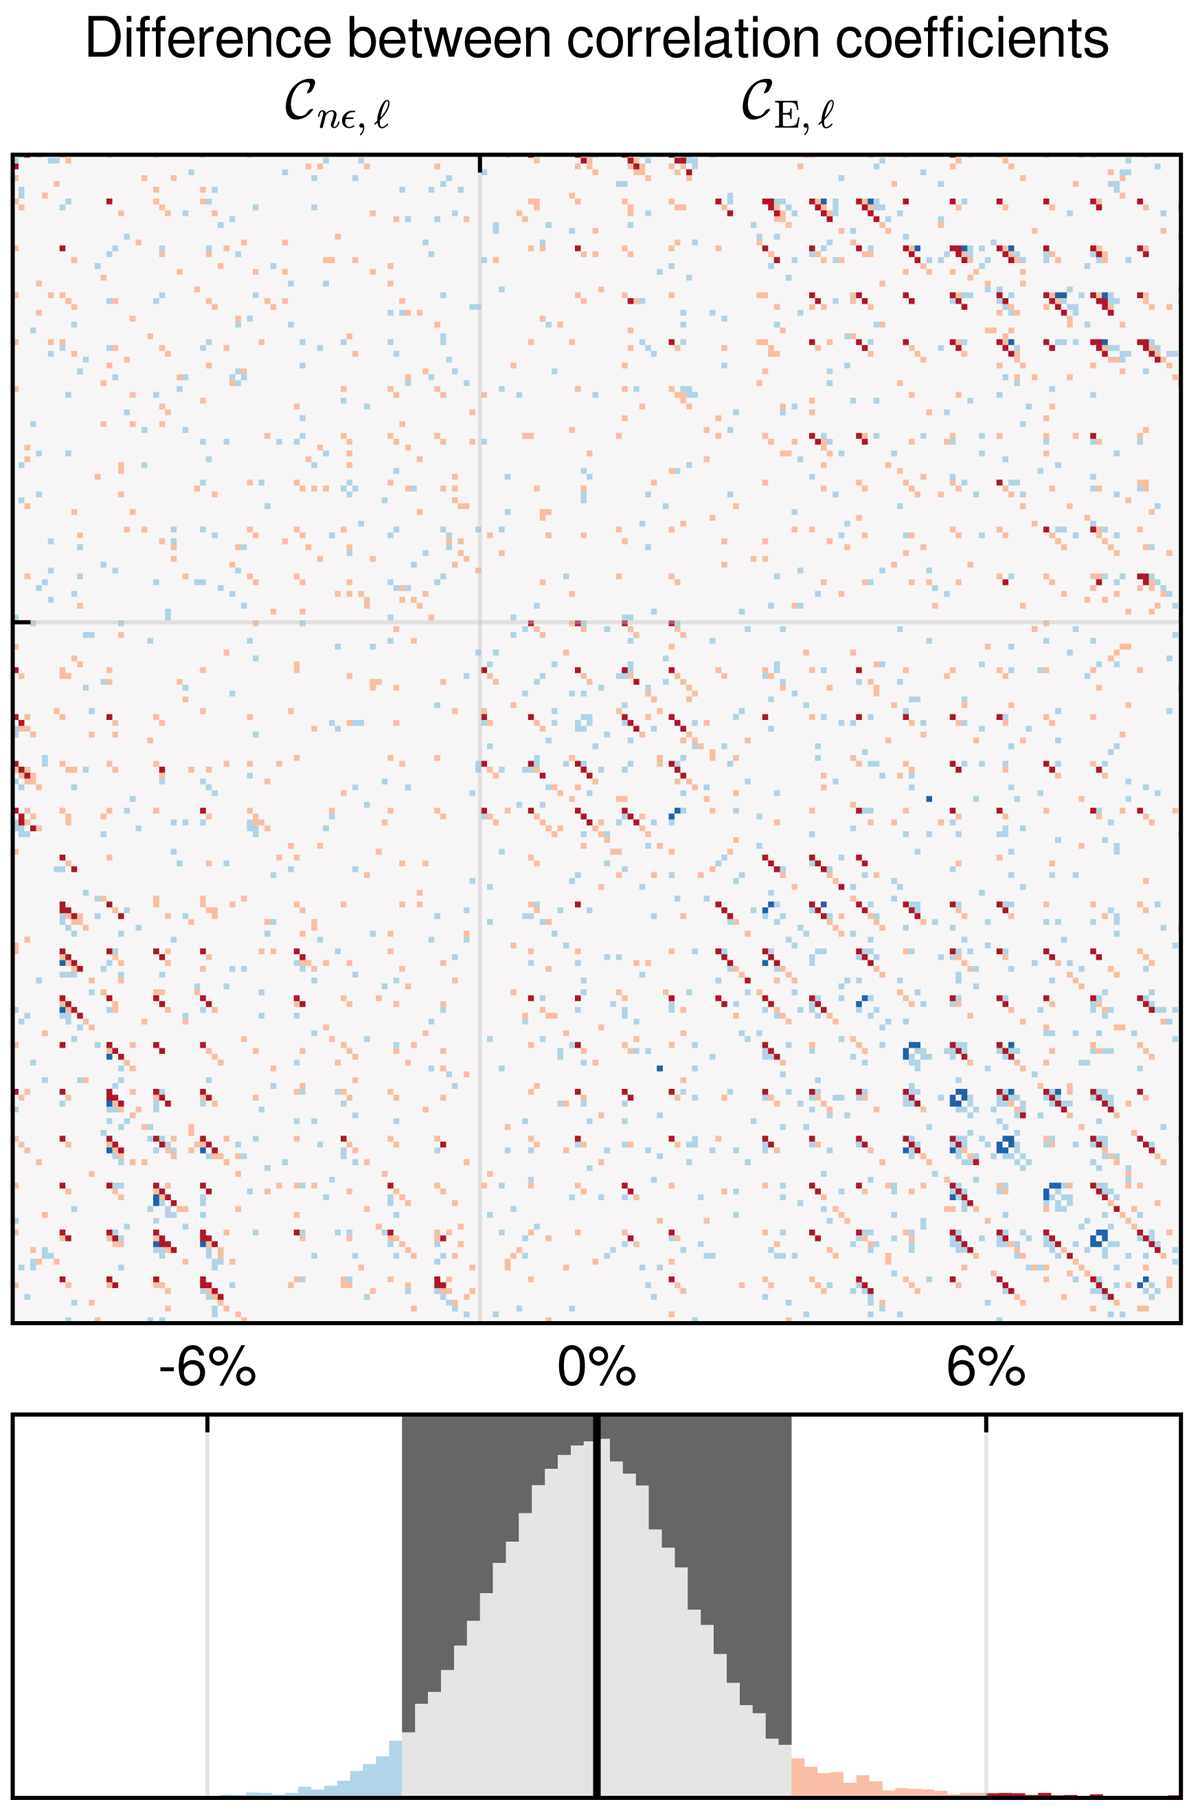
Relative difference between the correlation coefficients of the mock and analytic covariances of the weak lensing band power signals. Bottom: histogram of the relative differences marking values beyond ±6%( ± 3%) in dark (light) red and blue. Top: band power correlation matrix with elements coloured according to the value of the difference using the same scheme as in the matrix above.
Current usage metrics show cumulative count of Article Views (full-text article views including HTML views, PDF and ePub downloads, according to the available data) and Abstracts Views on Vision4Press platform.
Data correspond to usage on the plateform after 2015. The current usage metrics is available 48-96 hours after online publication and is updated daily on week days.
Initial download of the metrics may take a while.