Fig. D.5.
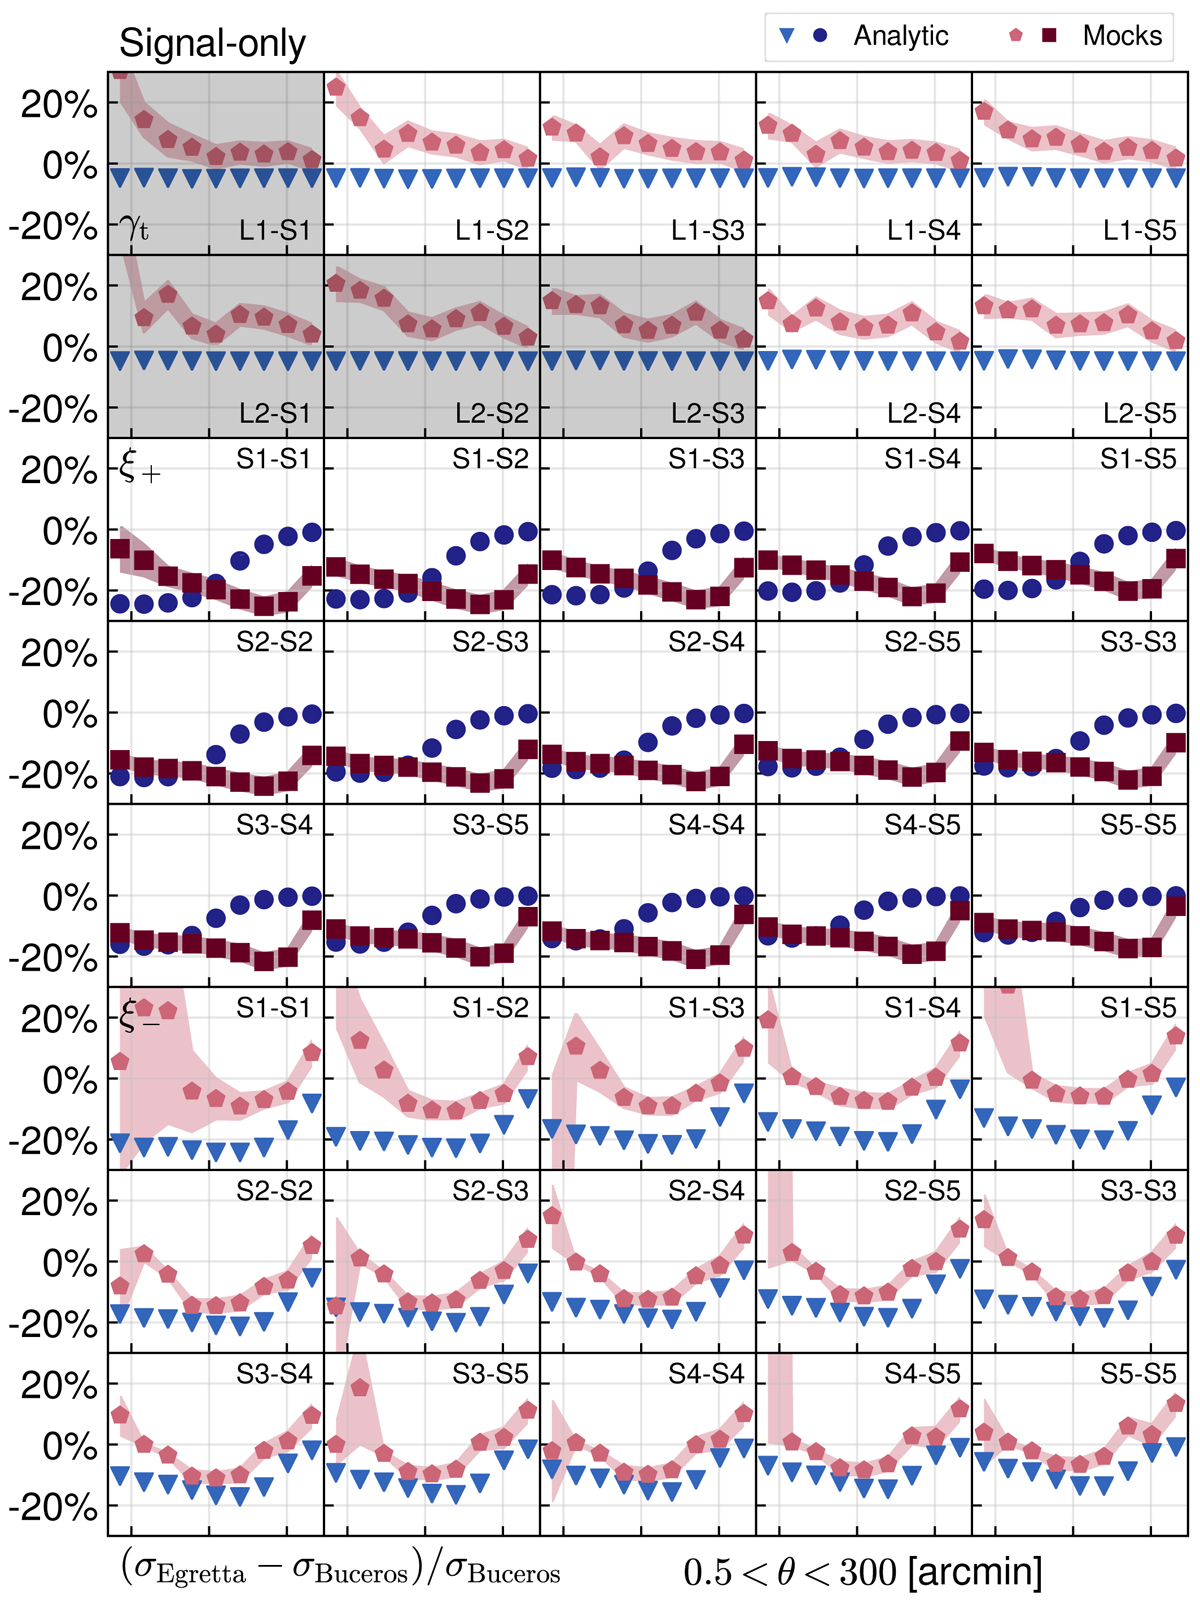
Relative difference between the square root of the diagonals in the Egretta (realistic mask and depth variations) and Buceros (rectangular mask, uniform depth) covariances of the weak lensing correlation functions, with all shape noise contributions removed (σϵ = 0). Red (blue) symbols show results for the mock (analytic) covariance. Bands around the mock data points indicate the standard error determined from a jackknife estimate of variance. Top two rows: GGL signals, centre three rows: ξ+, and bottom three rows: ξ−, with bin combinations indicated in the panels.
Current usage metrics show cumulative count of Article Views (full-text article views including HTML views, PDF and ePub downloads, according to the available data) and Abstracts Views on Vision4Press platform.
Data correspond to usage on the plateform after 2015. The current usage metrics is available 48-96 hours after online publication and is updated daily on week days.
Initial download of the metrics may take a while.