Fig. D.3.
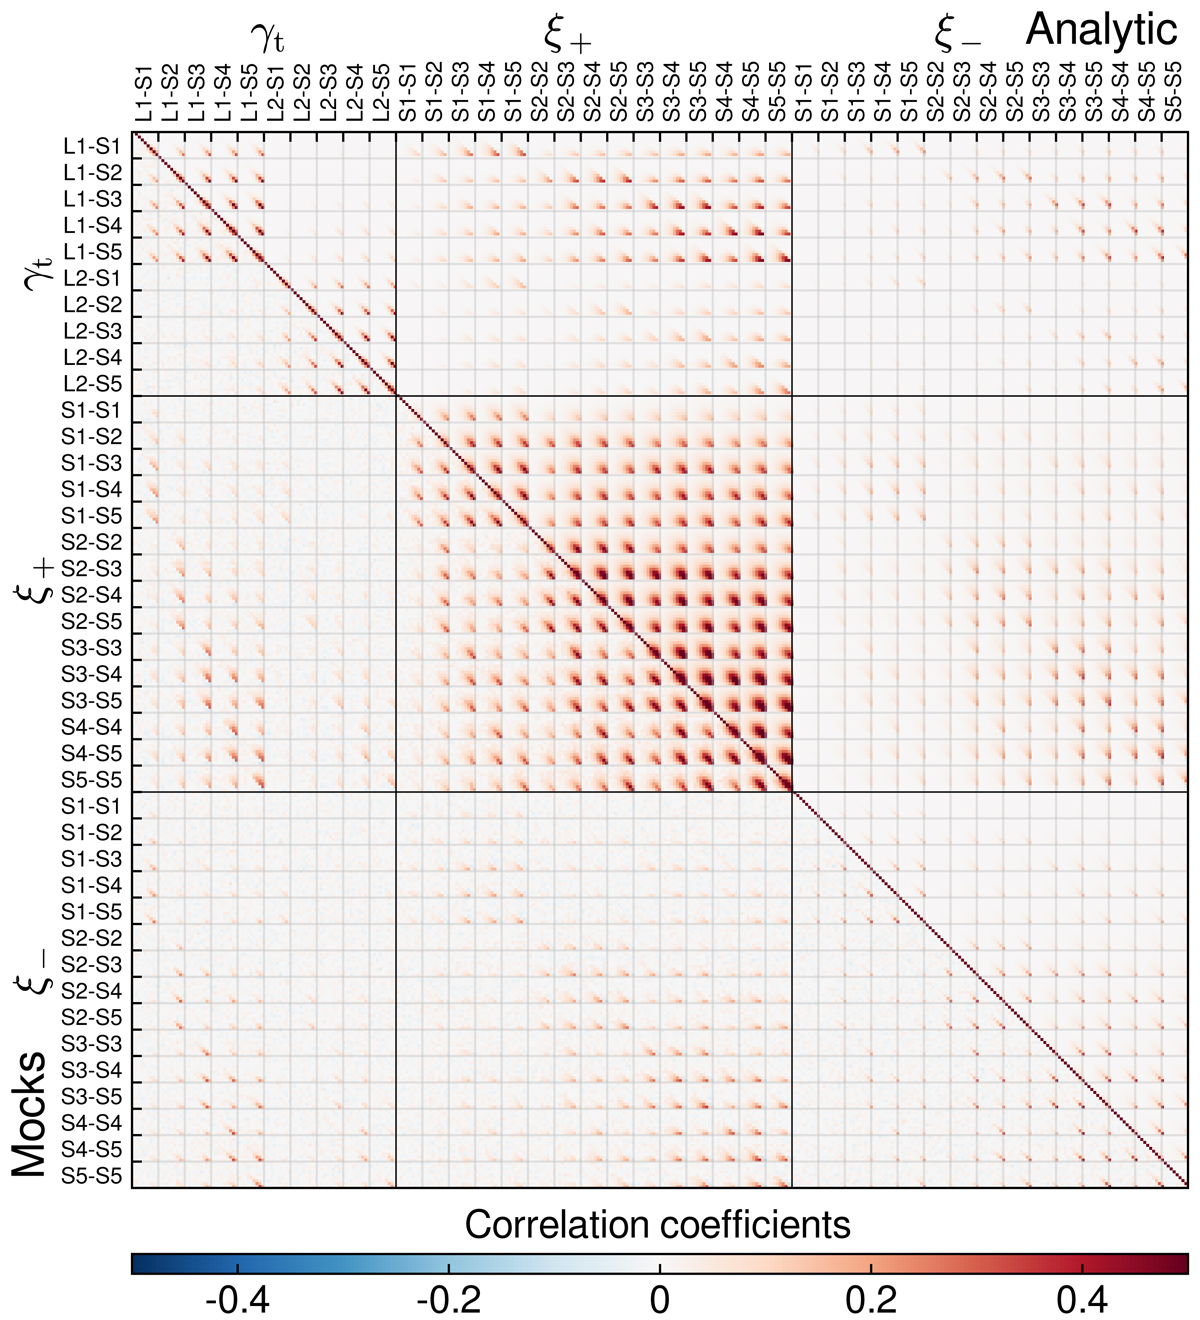
Comparison of the correlation coefficients in the weak lensing correlation function covariance between the mocks (lower left) and analytic approach (upper right) in the Egretta setup. As indicated in the labels, large blocks correspond to the correlation functions ⟨γt⟩, ξ+, and ξ−, while small blocks correspond to the tomographic bin combinations.
Current usage metrics show cumulative count of Article Views (full-text article views including HTML views, PDF and ePub downloads, according to the available data) and Abstracts Views on Vision4Press platform.
Data correspond to usage on the plateform after 2015. The current usage metrics is available 48-96 hours after online publication and is updated daily on week days.
Initial download of the metrics may take a while.