Fig. D.2.
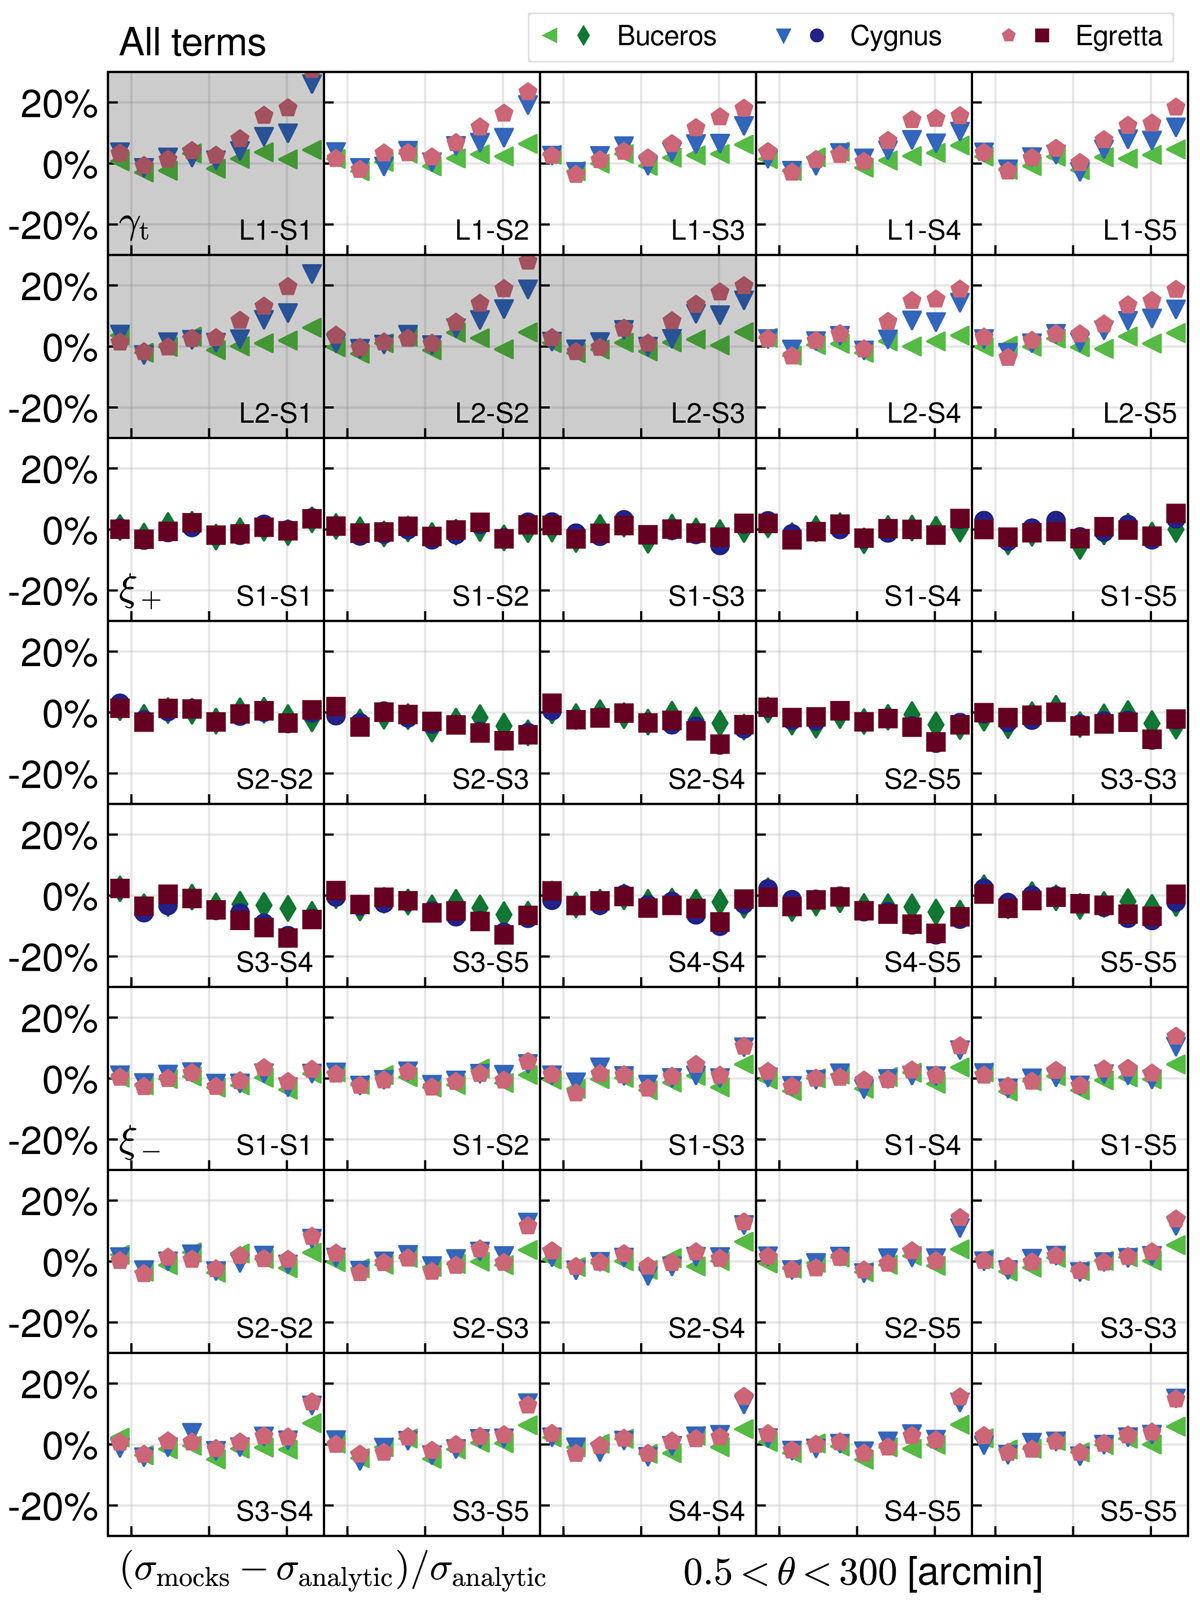
Relative difference between the square root of the diagonals of the mock and analytic covariances of the weak lensing correlation functions, i.e. the real-space analogue of Fig. 13. Top two rows: GGL signals, centre three rows: ξ+, and bottom three rows: ξ−, with bin combinations indicated in the panels. Three cases are shown: spatially uniform galaxy samples in a simple survey footprint (Buceros, green), spatially uniform galaxy samples in the realistic footprints (Cygnus, blue), and spatially varying samples in the realistic footprints (Egretta, red). GGL signals that are not used in the analysis have been greyed out.
Current usage metrics show cumulative count of Article Views (full-text article views including HTML views, PDF and ePub downloads, according to the available data) and Abstracts Views on Vision4Press platform.
Data correspond to usage on the plateform after 2015. The current usage metrics is available 48-96 hours after online publication and is updated daily on week days.
Initial download of the metrics may take a while.