Fig. D.1.
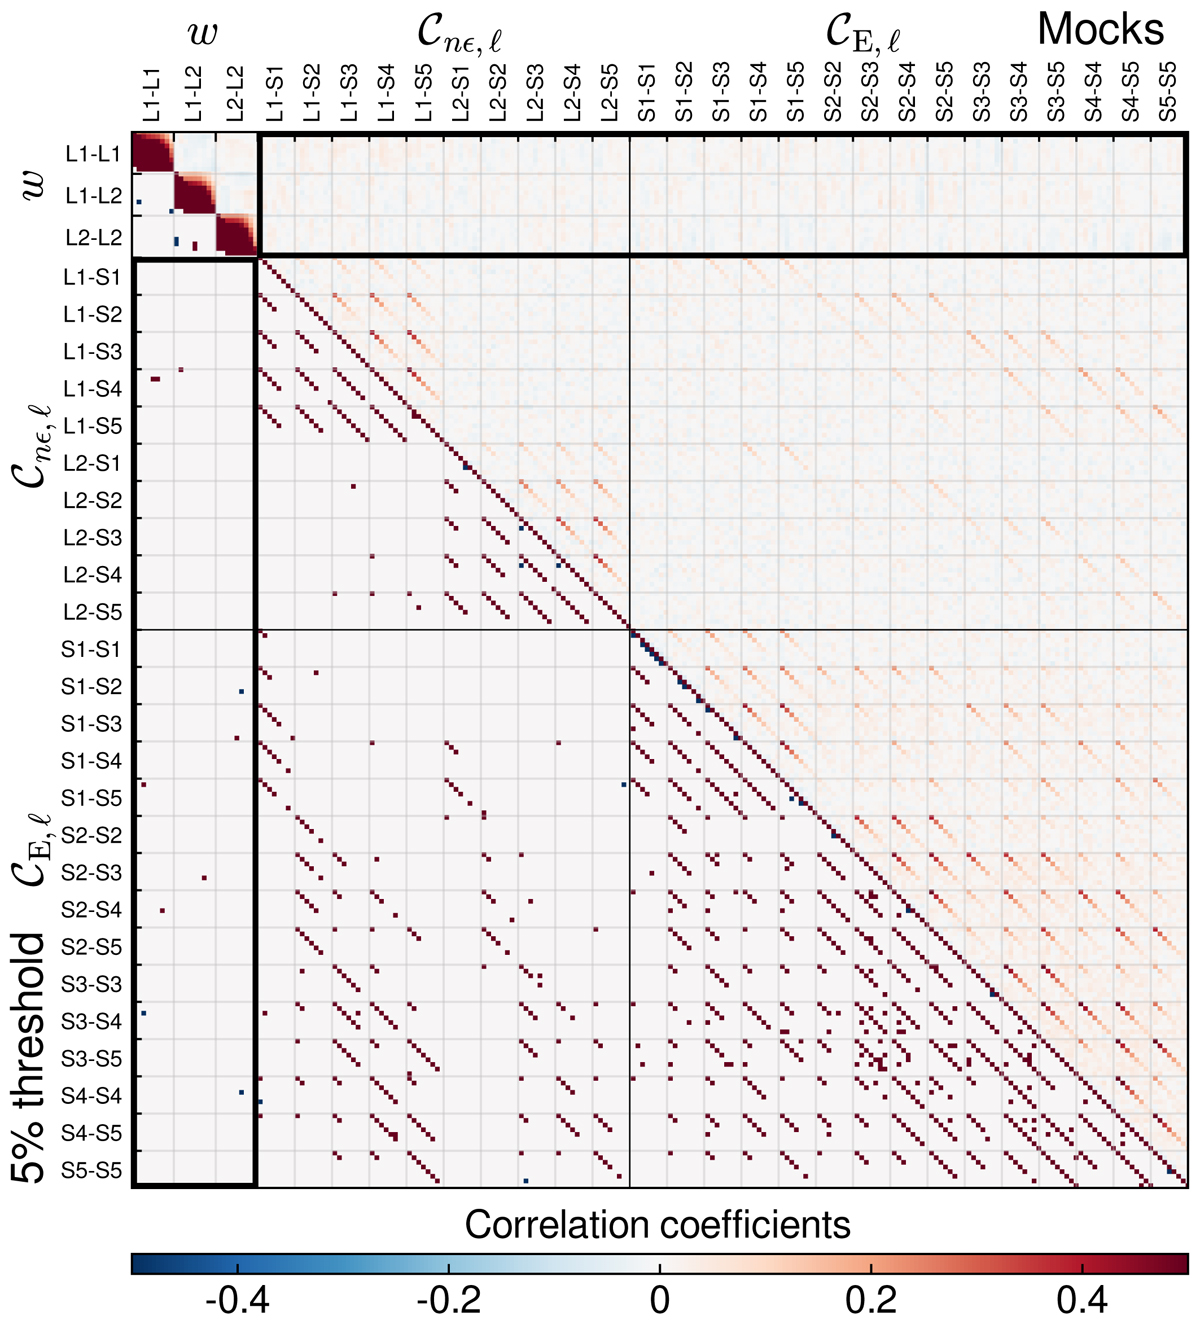
Correlation coefficient matrix for the angular galaxy clustering correlation function w, the galaxy-galaxy lensing band power 𝒞nϵ, and the cosmic shear band power 𝒞E calculated over the full BOSS and KiDS-1000 footprints. The upper triangle shows the correlation matrix as calculated from the mocks; the lower triangle indicates correlation coefficients above ±5%. The black rectangles highlight the cross-correlations between galaxy clustering and weak lensing statistics. These are negligible, with few elements fluctuating above the 5% threshold.
Current usage metrics show cumulative count of Article Views (full-text article views including HTML views, PDF and ePub downloads, according to the available data) and Abstracts Views on Vision4Press platform.
Data correspond to usage on the plateform after 2015. The current usage metrics is available 48-96 hours after online publication and is updated daily on week days.
Initial download of the metrics may take a while.