Free Access
Fig. B.1.
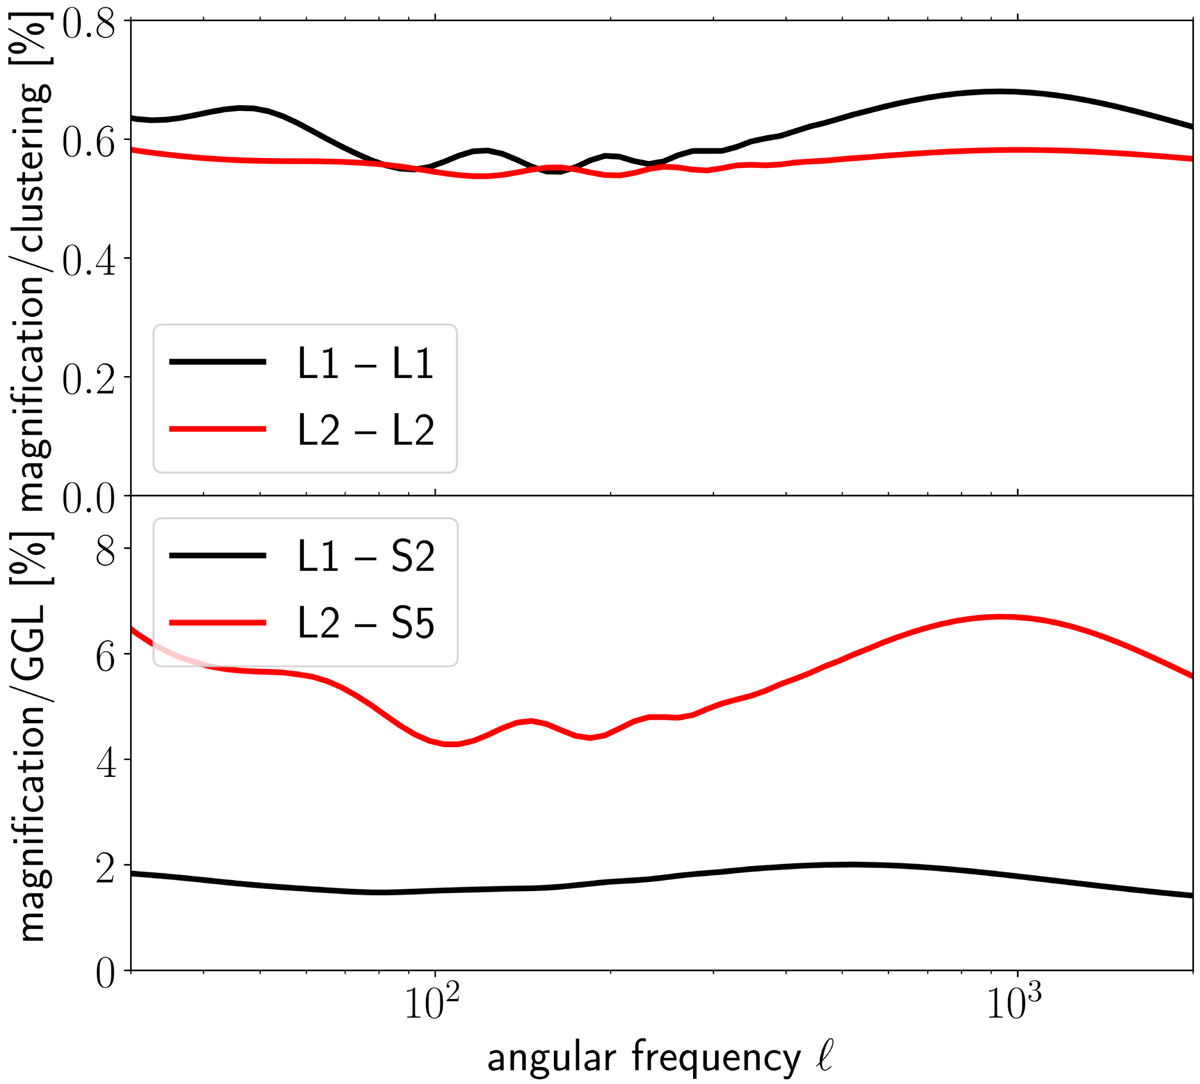
Magnification bias contribution relative to galaxy clustering (top panel) and the galaxy-galaxy lensing signal (bottom panel) for the redshift bin combinations indicated in the legends (cf. Table 2). Shown are angular power spectrum models assuming linear galaxy bias using the values from Table A.1.
Current usage metrics show cumulative count of Article Views (full-text article views including HTML views, PDF and ePub downloads, according to the available data) and Abstracts Views on Vision4Press platform.
Data correspond to usage on the plateform after 2015. The current usage metrics is available 48-96 hours after online publication and is updated daily on week days.
Initial download of the metrics may take a while.