Fig. 22.
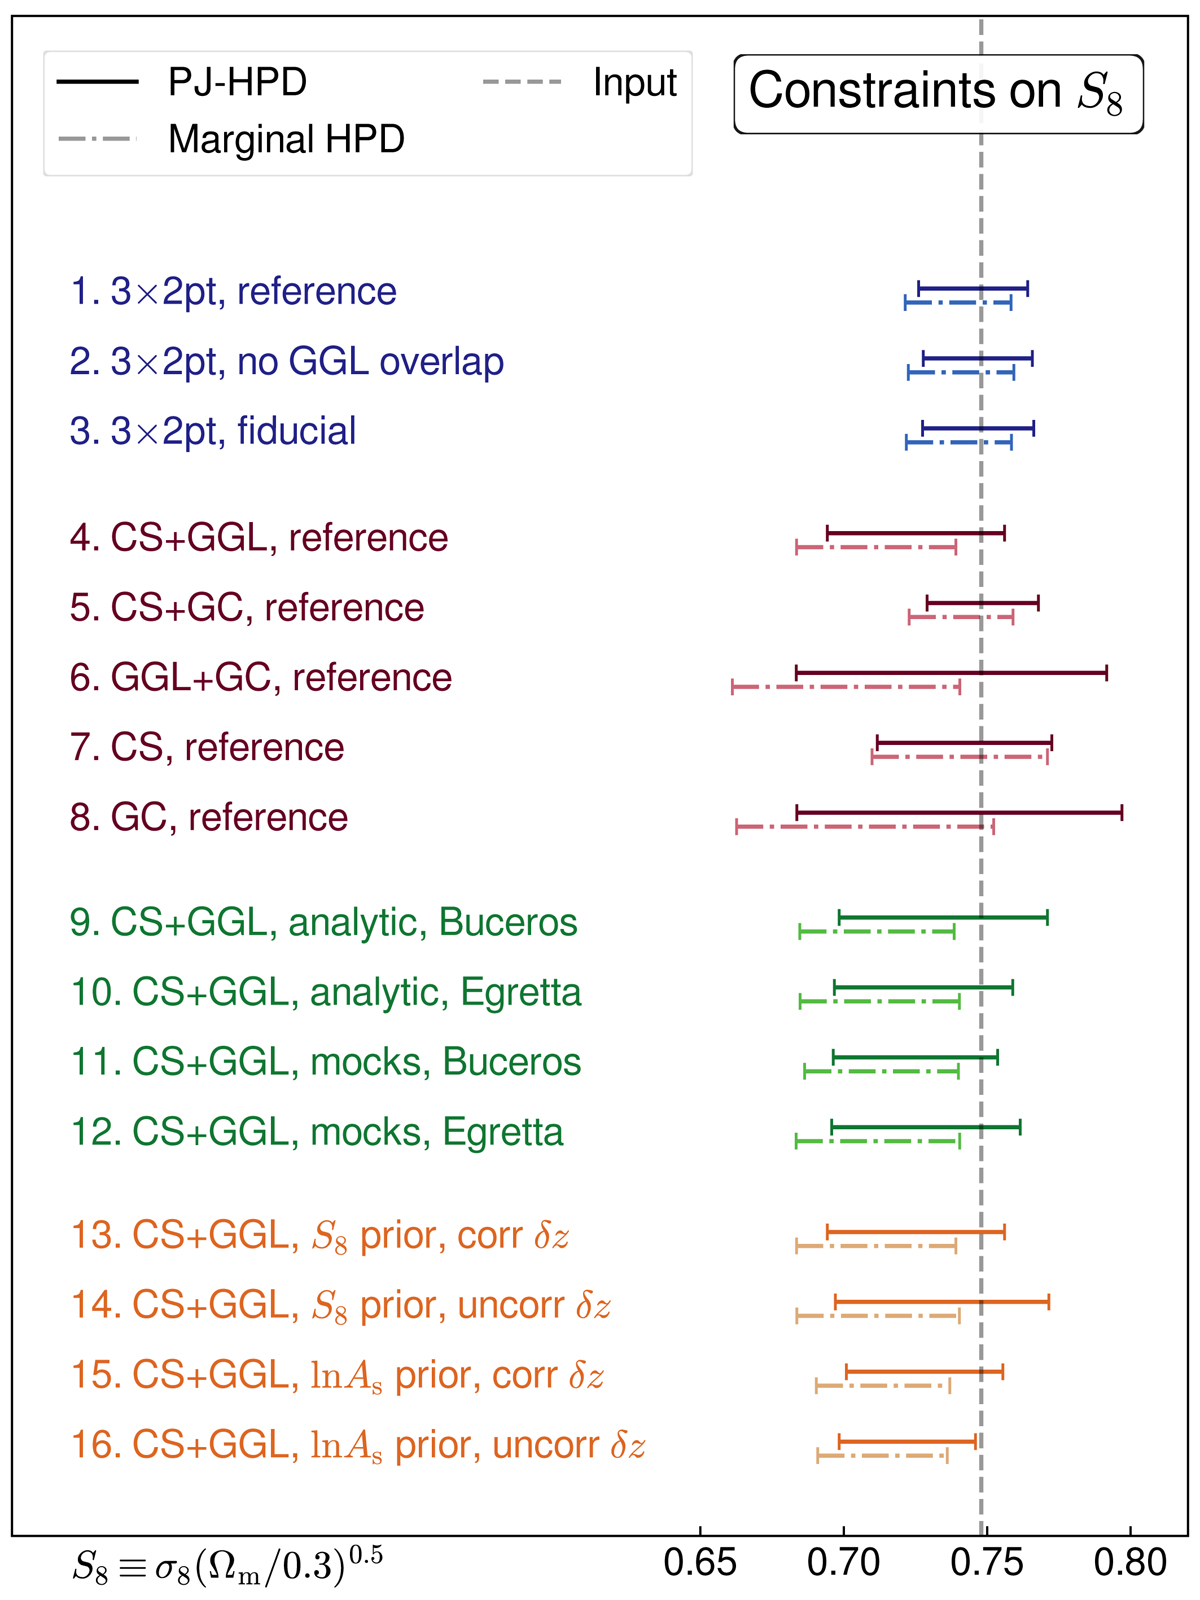
S8 constraints (1σ) for different compositions of the GGL data vector in the joint analysis (blue), probe combinations (red), different covariance models (green), and different prior assumptions (orange). Standard marginal (M-)HPD credible intervals are shown as dot-dashed lines; PJ-HPD intervals as solid lines. The grey dashed line indicates the input value of S8. The corresponding interval widths, as well as explanations of the case labels, are given in Table 5. The M-HPD intervals are generally shifted to S8 values lower than the input; see text and Sect. 6.4 for a discussion.
Current usage metrics show cumulative count of Article Views (full-text article views including HTML views, PDF and ePub downloads, according to the available data) and Abstracts Views on Vision4Press platform.
Data correspond to usage on the plateform after 2015. The current usage metrics is available 48-96 hours after online publication and is updated daily on week days.
Initial download of the metrics may take a while.