Fig. 20.
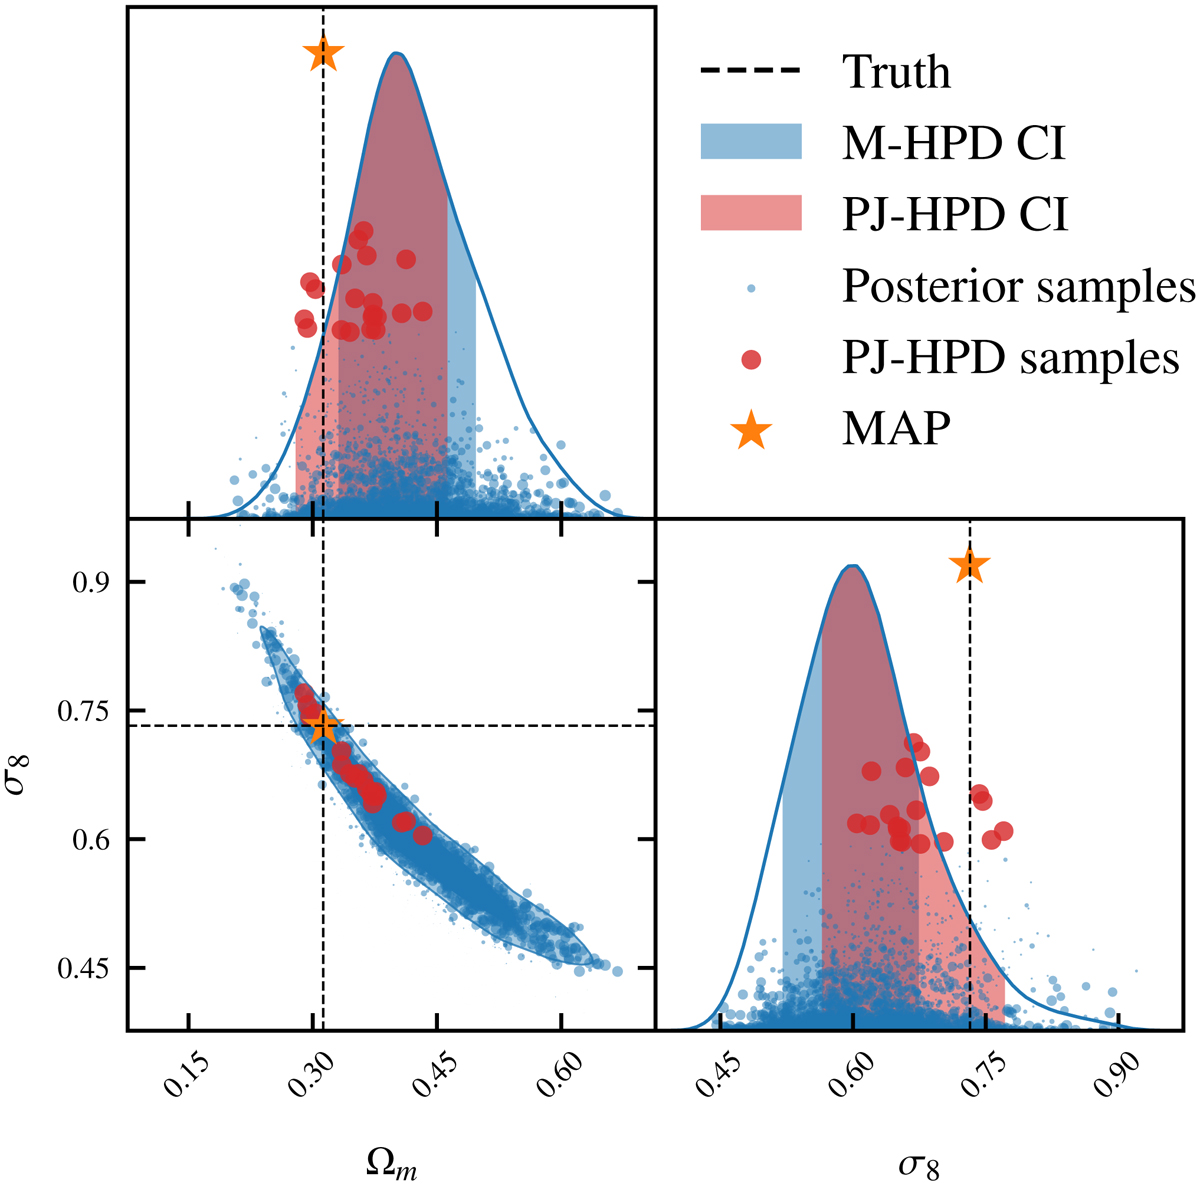
Illustration of 1σ credible intervals (CI) used to report parameter constraints, for a subset of two parameters for an exemplary mock joint analysis of GGL and cosmic shear with a noiseless data vector. The standard marginal highest posterior density (M-HPD) CIs are shown in blue. The marginal posterior mode is shifted with respect to the true input parameter values (black dashed lines), whereas the maximum a posteriori (MAP) estimate (orange star) tracks the truth well. The CI we associate with the MAP is constructed via the PJ-HPD method (red), using the samples with the highest posterior density (red points). Other posterior samples are shown as blue points, with point size proportional to their posterior mass. Top and right panels: height of the points and of the MAP indicate their posterior density with arbitrary scaling.
Current usage metrics show cumulative count of Article Views (full-text article views including HTML views, PDF and ePub downloads, according to the available data) and Abstracts Views on Vision4Press platform.
Data correspond to usage on the plateform after 2015. The current usage metrics is available 48-96 hours after online publication and is updated daily on week days.
Initial download of the metrics may take a while.