Fig. 2.
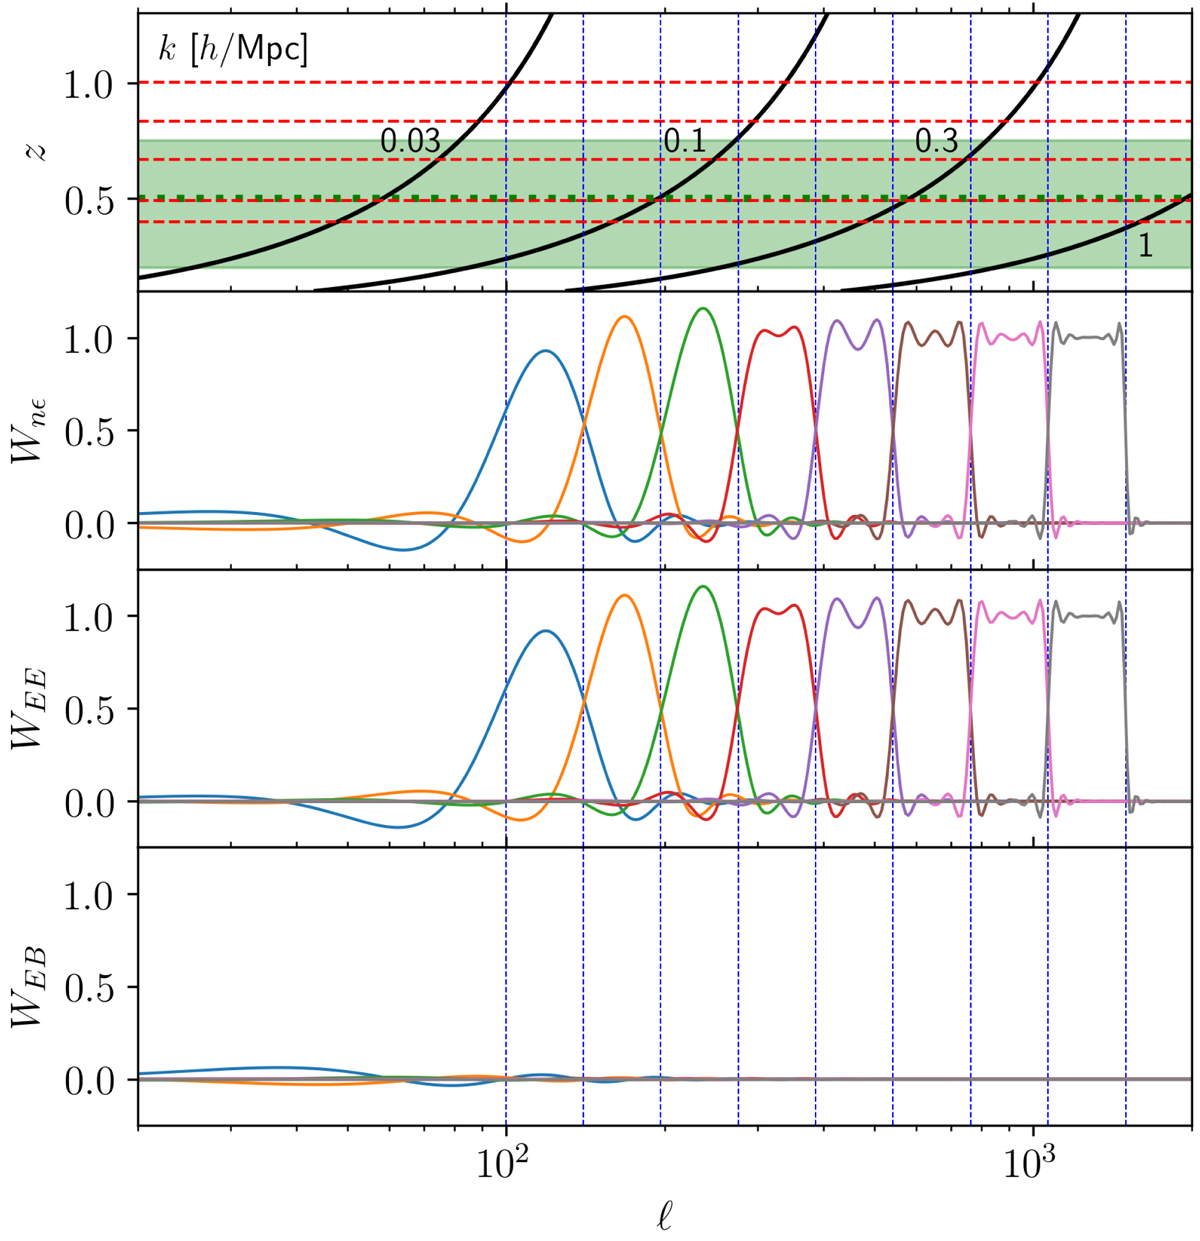
Bandpower Fourier-space filters for 8 bands logarithmically spaced ℓ ∈ [100, 1500], as indicated by the vertical lines. The second to fourth panels from the top show the galaxy-galaxy lensing, cosmic shear, and EB-mode mixing kernels; see Eqs. (26) and (33). The top panel shows redshift z as a function of ℓ for a selection of wavenumbers k given in units of h Mpc−1. Red horizontal lines mark the mean redshifts of the source redshift bins, and the green band shows the redshift range of the two lens samples with a split at z = 0.5. The apodisation width is chosen as Δx = 0.5.
Current usage metrics show cumulative count of Article Views (full-text article views including HTML views, PDF and ePub downloads, according to the available data) and Abstracts Views on Vision4Press platform.
Data correspond to usage on the plateform after 2015. The current usage metrics is available 48-96 hours after online publication and is updated daily on week days.
Initial download of the metrics may take a while.