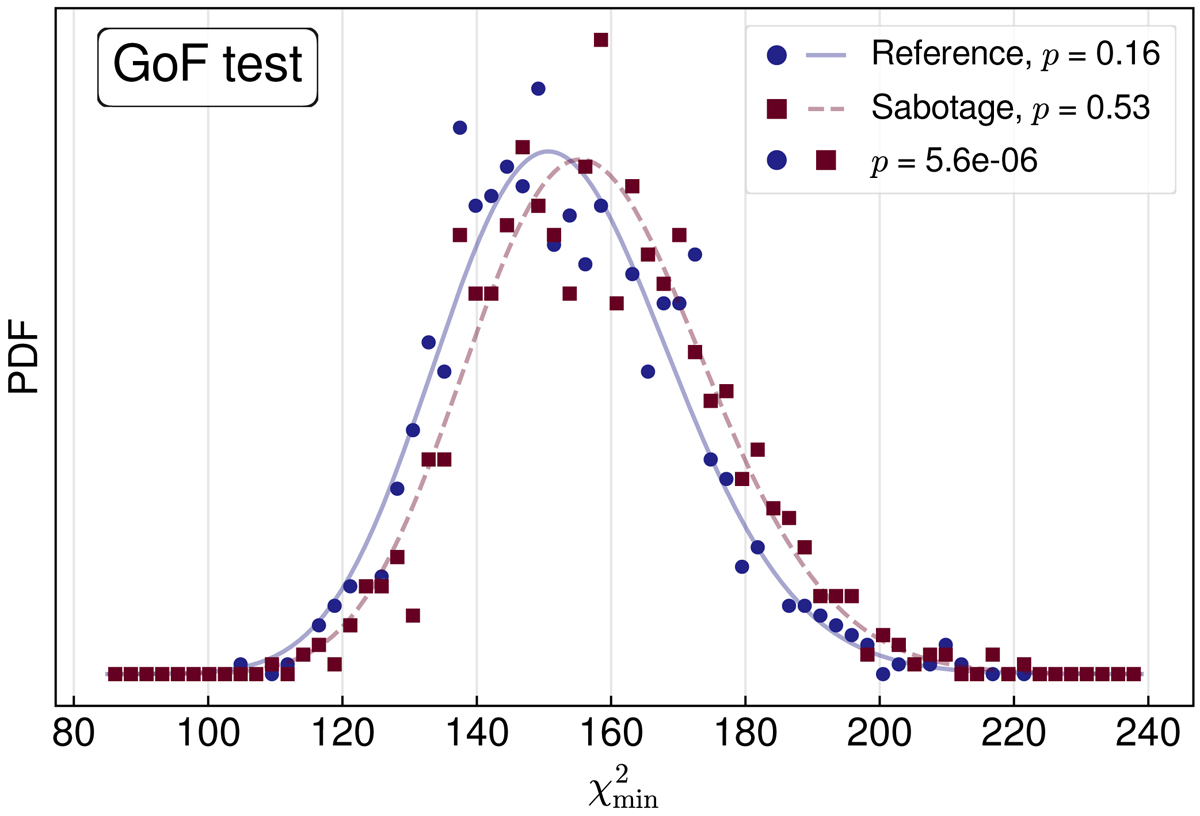
Fig. 18.

Goodness of fit sampling distributions. Shown are histograms of minimum χ2-values obtained from 1000 mock realisations of data vectors analysed with our cosmic shear and GGL analysis pipeline. Blue points correspond to our baseline setup; red points to the result using a sabotaged data vector computed with the S3 and S4 redshift distributions systematically shifted upwards by 5σ of their Gaussian prior width. The curves are best fits of a χ2-distribution with its mean as free parameter. The solid blue curve is a good fit to the baseline results (p-value of 0.16), while the sabotaged distribution is still well fitted by a χ2-distribution (red dashed curve; p = 0.53) which however is incompatible with the baseline (p < 10−5).
Current usage metrics show cumulative count of Article Views (full-text article views including HTML views, PDF and ePub downloads, according to the available data) and Abstracts Views on Vision4Press platform.
Data correspond to usage on the plateform after 2015. The current usage metrics is available 48-96 hours after online publication and is updated daily on week days.
Initial download of the metrics may take a while.


