Fig. 11.
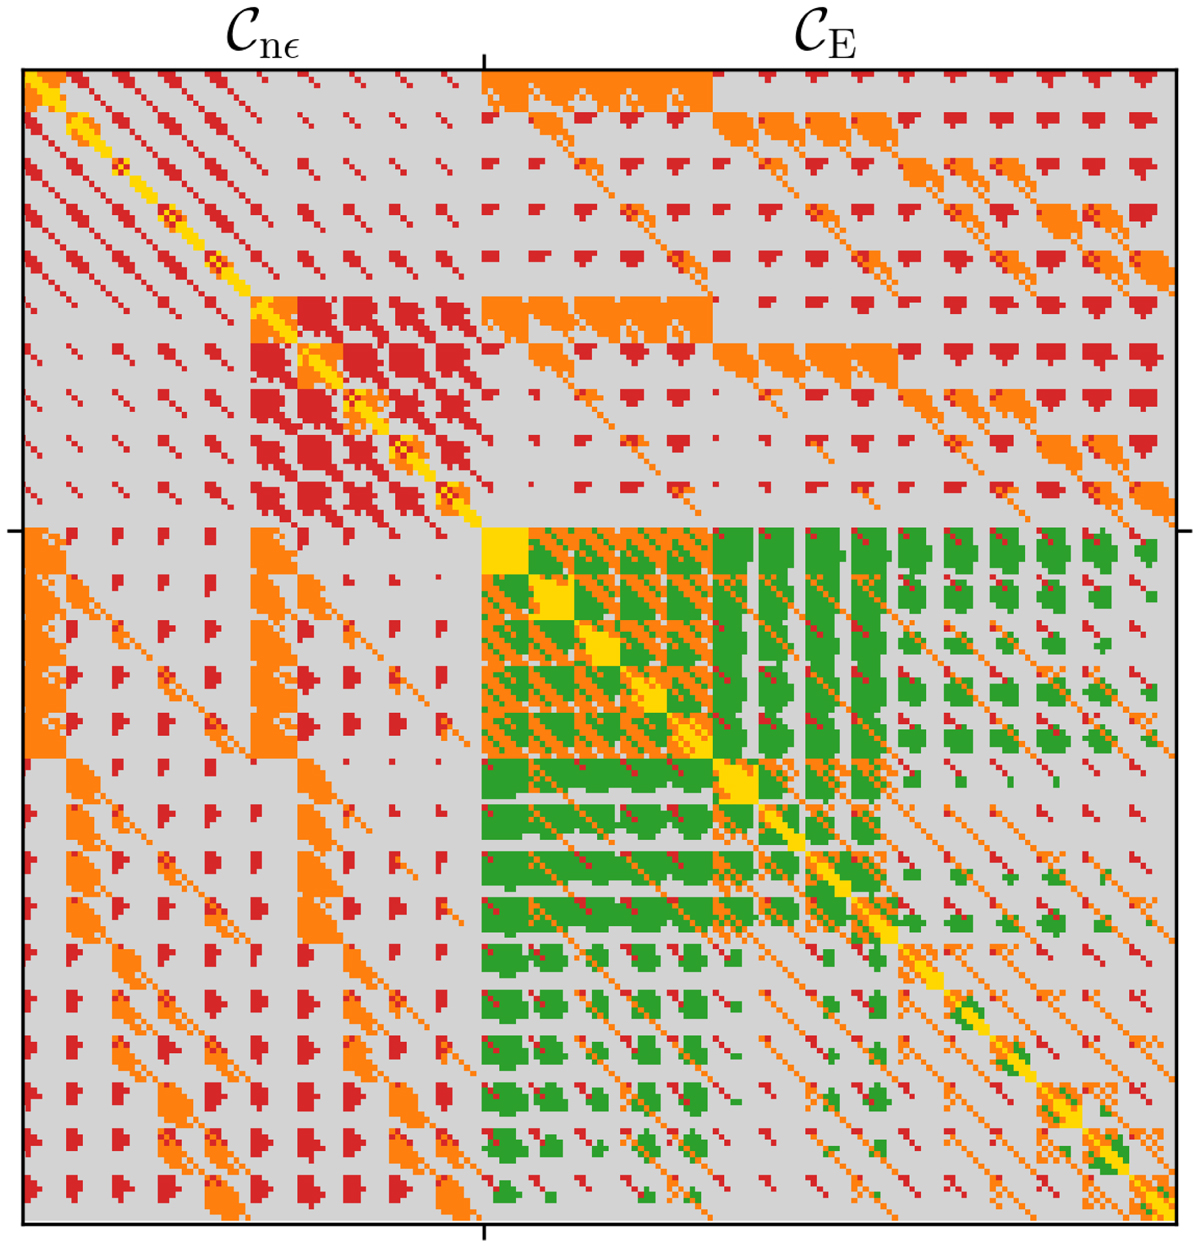
Dominant contribution (absolute value) to the band power covariance. The colour coding is identical to Fig. 10, i.e. sample variance (red), mixed term (orange), and shot/shape noise (yellow) in the Gaussian covariance; non-Gaussian in-survey covariance (purple, always sub-dominant) and super-sample covariance (green); and the multiplicative shear bias uncertainty (grey). The top left block contains the covariance of the GGL signals (𝒞nϵ; without cuts in tomographic bins or angular scales), the bottom right block the cosmic shear covariance (𝒞E). Smaller blocks discernible correspond to the different bin combinations, and within these, individual 8 × 8 blocks correspond to the eight band powers of the signal for a single tomographic bin combination.
Current usage metrics show cumulative count of Article Views (full-text article views including HTML views, PDF and ePub downloads, according to the available data) and Abstracts Views on Vision4Press platform.
Data correspond to usage on the plateform after 2015. The current usage metrics is available 48-96 hours after online publication and is updated daily on week days.
Initial download of the metrics may take a while.